Railsでの分散トレーシングやAPMに関して記載しますが、この記事の内容は不完全です。
Rails および OpenTelemetry、Zipkin、Jaeger あたりのキーワードで何か調べている人にとっては役に立つ部分があるかもしれません。
背景
普段はRailsアプリケーションのAPMに Elastic APM や NewRelic をゆるく利用しています。軽くAPMをお使う程度では必要十分で困っていなかったのですが、オープンな技術(Zipkin)でトレース情報を表示したらどうなるだろうかと関心を持ったのがきっかけで少し試してみました。
以降の記載は「少しかじってみた」程度のナレッジですので、理解不足を多く含む前提で参照してください。
この記事では以下の点を記載しています。
- OpenTelemetry に出会った話
- Jaeger を動かして、Railsのメトリクスを送ってみる
- Zipkin を動かして、Railsのメトリクスを送ってみる
OpenTelemetry
OpenTelemetry is a collection of tools, APIs, and SDKs. Use it to instrument, generate, collect, and export telemetry data (metrics, logs, and traces) to help you analyze your software’s performance and behavior.
OpenTelemetry
CNCFの Incubating project としてホストされている。
定番言語いろいろな値を収集してくれるツールという位置づけ。これまでは、例えばElasticAPMならば Ruby用のGemを作ったり、その他言語用にも別にライブラリを実装したり・・・と分割損が生じていたものが、OpenTelemetry の仕様(ツール)を介することで効率的に対応言語を増やせるメリットがある。
概念的には、「RubyにおけるHTTPサーバー仕様を抽象化した Rack」みたいな関係性で捉えればよさそう。以下は、Elastic APM のドキュメントページに掲載されている OpenTelemetry のアーキテクチャ図。
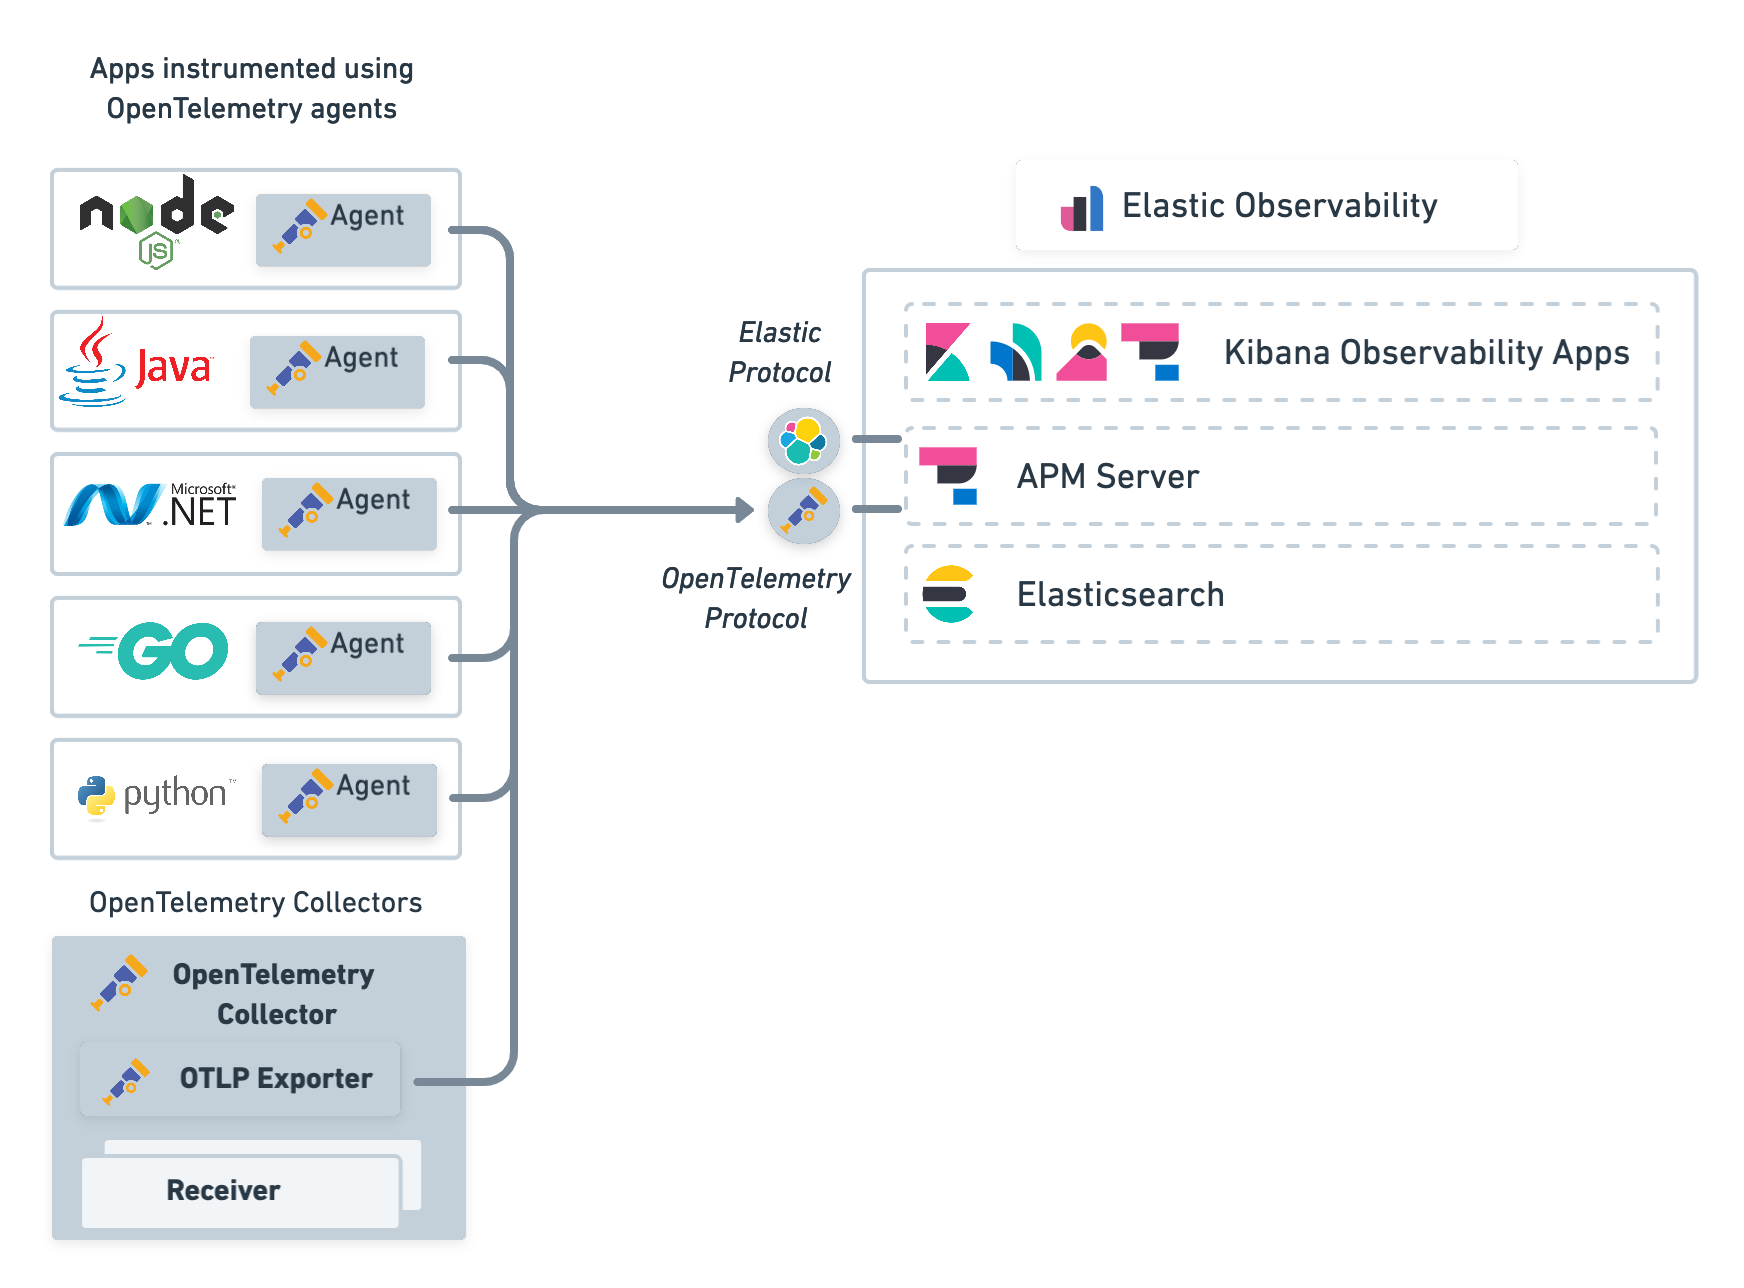
引用 (Source):OpenTelemetry integration | APM User Guide [8.3] | Elastic
Gemをセットアップしてみる
大きくは以下3つのカテゴリに分かれている様子。
opentelemetry-sdk- 基本となるSDK部分
opentelemetry-instrumentation-*- 欲しい計測値にあわせてライブラリが分かれている
- railsなら ActiveModel 関連が見れるし、 mysql2 ならSELECT文まで見ることができる
opentelemetry-exporter-*- 最終的になんの可視化UIにデータを送りたいかを選ぶ。ここで例えば Zipkin が登場する
- OTLP (OpenTelemetry Protocol ?) を使うと、ここで冒頭に記した「抽象化」の仕事をしてくれる
- 後に出てくる Agent とか Collector とかで分かれてくる
- Agent は、各言語実装で Export 先に対してデータを送る
- Collector は、Collector としての役割を持つ別のサーバーを立ち上げて、それが各Export先に対してデータを送る責務を担ってくれる。つまり、各言語は Collector に対してさえ標準仕様でデータを送れば、この送り先に対しては関心を保つ必要がない
gem 'opentelemetry-sdk'
gem 'opentelemetry-instrumentation-all'
gem 'opentelemetry-instrumentation-rails'
gem 'opentelemetry-instrumentation-mysql2'

gem 'opentelemetry-exporter-zipkin'
gem 'opentelemetry-exporter-jaeger'
# gem 'opentelemetry-exporter-otlp'
Ruby版の OpenTelemetry モジュールの核の場所は以下。Jaeger や Zipkin 等の Exporter は ./exporter ディレクトリにあります。
Jaeger
Zipkinを試してみるつもりでこの調査をはじめたところだが、そこらじゅうで Jaeger の表記が出てくる。こちらも同じような役割を持つUI(サーバー)で、Zipkinのデータフォーマットと互換がある。後発なだけあって(?)機能面もいろいろ優れている印象。これから新規で使うならばJaegerでいいのではないか。
Jaeger の起動
version: "3"

services:
  rails:
    image: jaegertracing/all-in-one:1.6
    ports:
      - "3000:3000"
      - "5775:5775/udp"
      - "6831:6831/udp"
      - "6832:6832/udp"
      - "5778:5778"
      - "16686:16686"
      - "14268:14268"
      - "9411:9411"
    environment:
      COLLECTOR_ZIPKIN_HTTP_PORT: 9411
Bundle install したところthrift 関連でエラーが出たが、以下の一行追加で一応解決した。
bundle config build.thrift --with-cppflags="-Wno-error=compound-token-split-by-macro"
bundle install
doc/troubleshooting/ruby.md · main · GitLab.org / GitLab Development Kit · GitLab
Jaegerの起動ポートは 16686
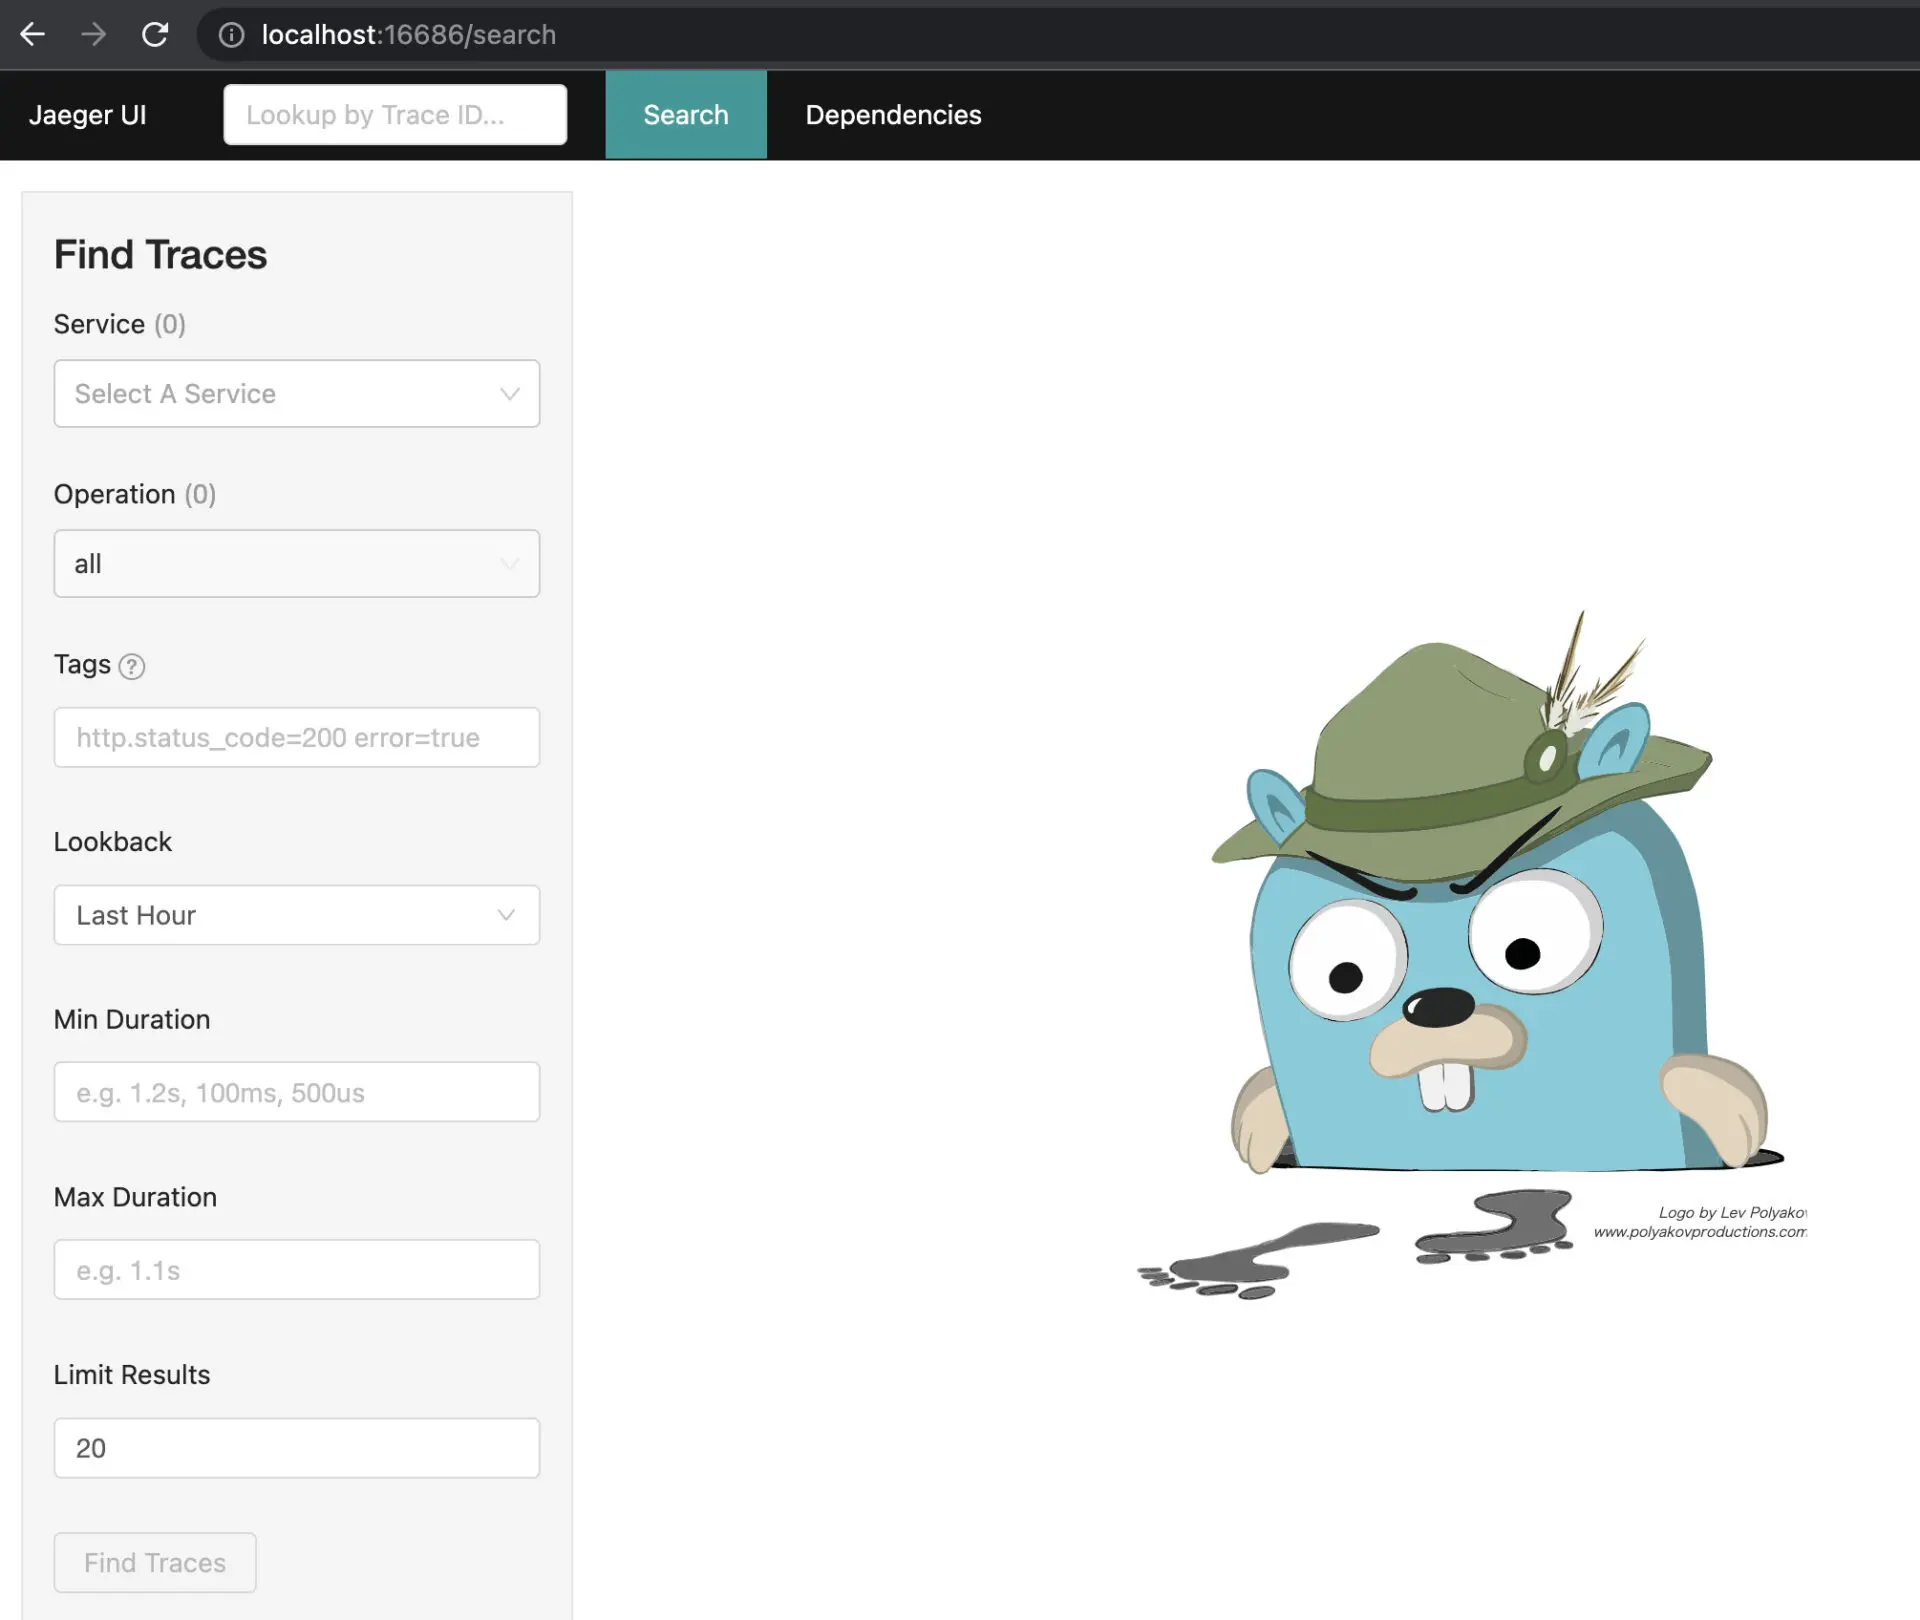
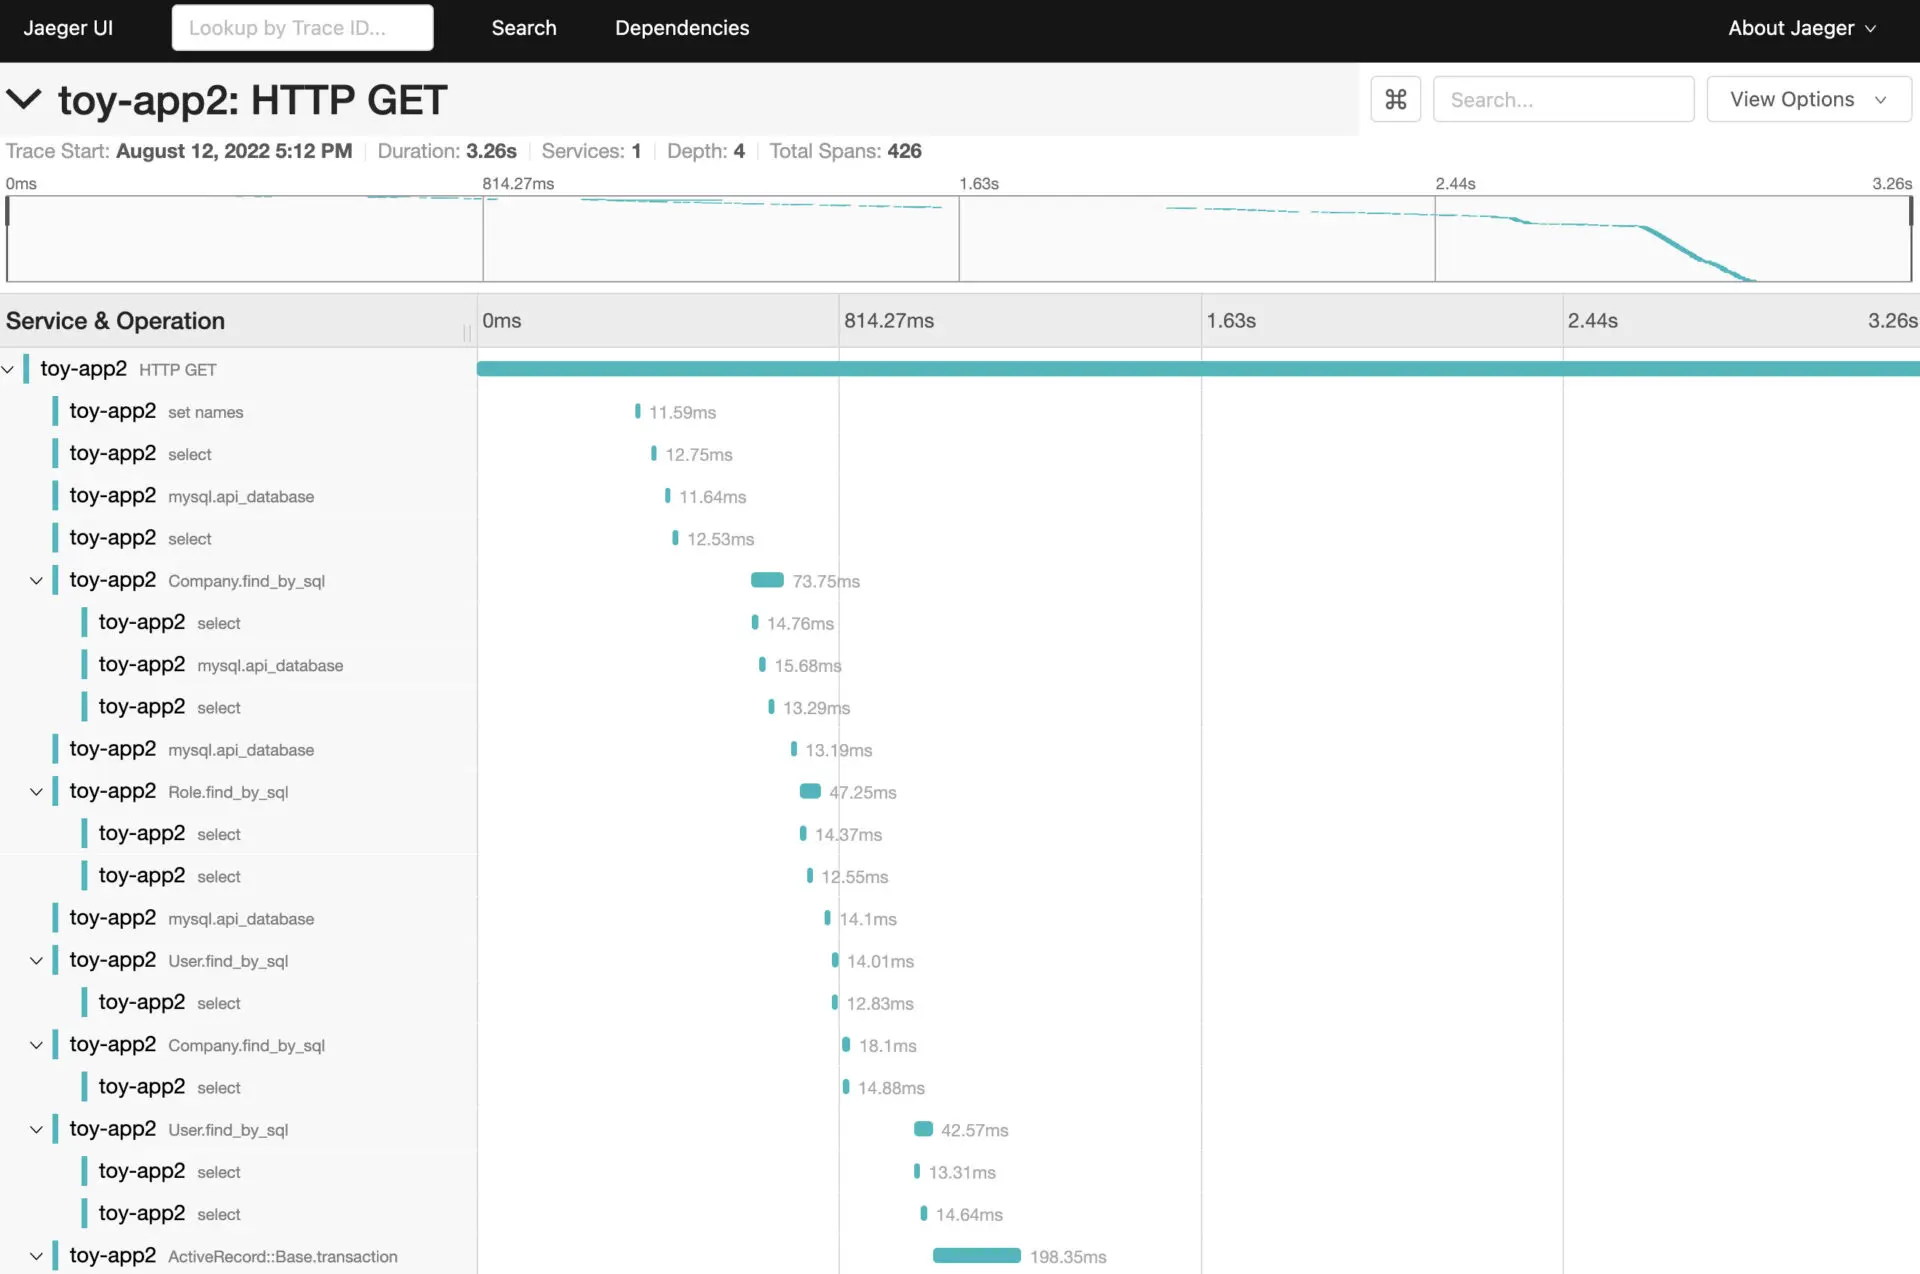
起動直後の画面。
上部のバーで表示時間幅の絞り込みができる。
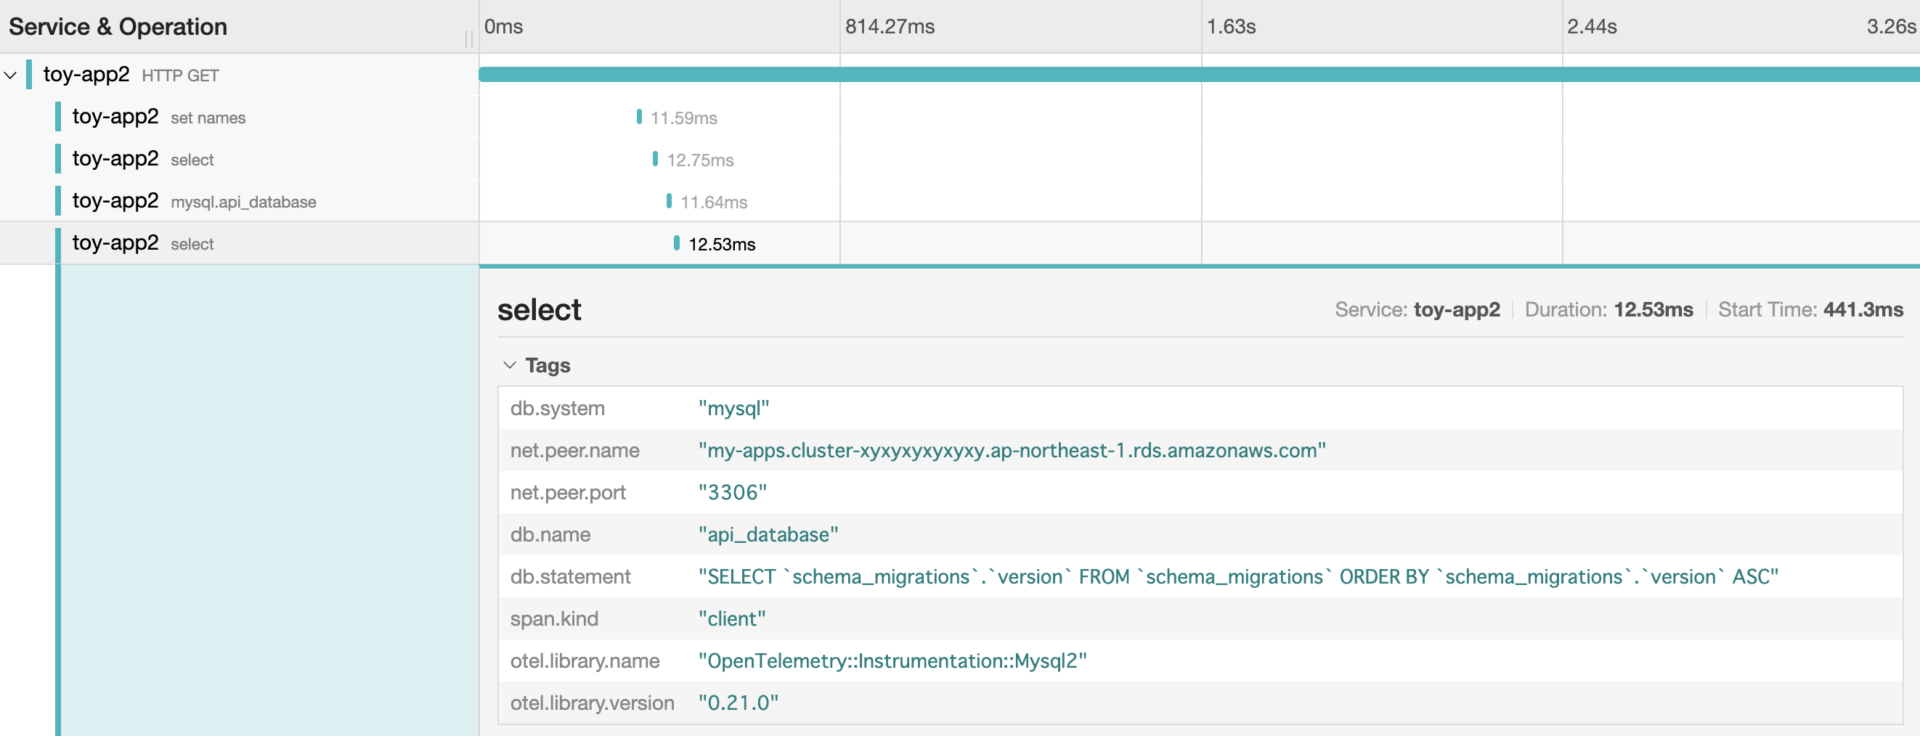
OpenTelemetry::Instrumentation::Mysql2 などはの Instrumentation は、こういう部分で細部を表示してくれる役割があるようだ。
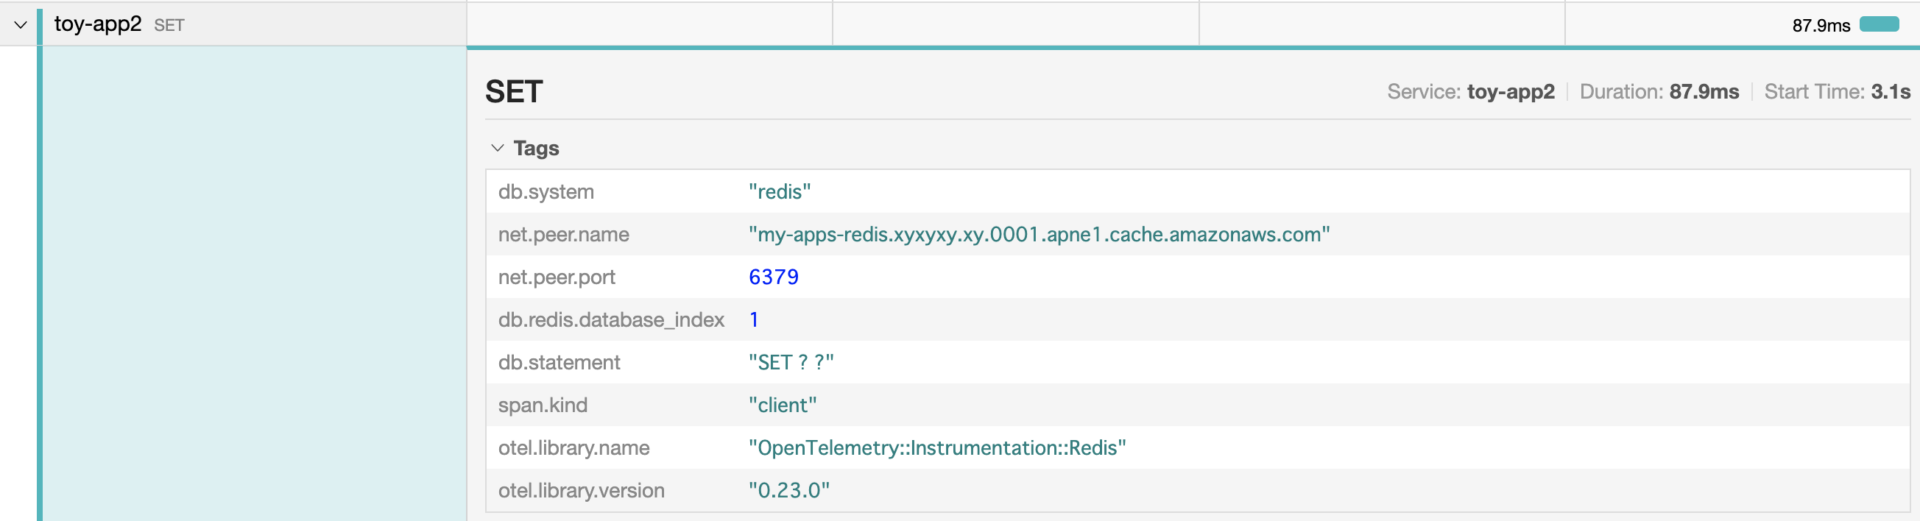
OpenTelemetry::Instrumentation::Redis の場合だとこんな感じ。
Jaeger のコンフィグ
Rails で動かす場合の設定例。initializer/telemetry.rb に記載。
- 冒頭で書いた Collector やら Agent やらの使い分けの例。それぞれで送り先となる Port も違う。
BatchSpanProcessorをかまさないとSPAN(トレーシングの細かい単位)がバラバラになってしまうので、まとめるために必要みたい。実際、書かないと1個1個が独立してしまって全く使い物にならなかった。c.use_allを使わないとSPANがまとまらない謎な事象が発生。深堀りはしていないので不明。
require 'opentelemetry/sdk'
require 'opentelemetry/exporter/jaeger'
require 'opentelemetry/instrumentation/all'
require 'opentelemetry-instrumentation-rails'

ENV['OTEL_TRACES_EXPORTER'] = 'jaeger'

ENV['OTEL_SERVICE_NAME'] = 'jaeger-example'
ENV['OTEL_SERVICE_VERSION'] = '0.6.0'


# The exporter will connect to localhost:6831 by default. To change:
# ENV['OTEL_EXPORTER_JAEGER_AGENT_HOST'] = '127.0.0.1'
# ENV['OTEL_EXPORTER_JAEGER_ENDPOINT'] = 'http://127.0.0.1:14268/api/traces'
# ENV['OTEL_EXPORTER_JAEGER_AGENT_PORT'] = 12345

exporter = OpenTelemetry::Exporter::Jaeger::CollectorExporter.new(
  endpoint: 'http://localhost:14268/api/traces'
)
# exporter = OpenTelemetry::Exporter::Jaeger::AgentExporter.new(
#   host: '127.0.0.1', port: 6831, max_packet_size: 65_000)
processor = OpenTelemetry::SDK::Trace::Export::BatchSpanProcessor.new(exporter)

OpenTelemetry::SDK.configure do |c|
  c.add_span_processor(
    processor
  )
  c.service_name = 'toy-app2'
  # c.service_version = '0.1.0'

  c.use_all
  # c.use 'OpenTelemetry::Instrumentation::Rails'
  # c.use 'OpenTelemetry::Instrumentation::Mysql2'
end
Zipkin
Jaeger の次は、当初目的だった Zipkin へ。
当初はこちらを使うつもりで Kubernetes 上に立ち上げたものの、Jaeger を使ったので不要になりました。とりあえずの起動目的なら以下のデプロイで動きます。
- Ingress で HTTPS提供すつるもりで作成している
- テスト用なので Storage は メモリ (mem) としている
ZIpkinの起動 (Kubernetes)
---
apiVersion: v1
kind: Namespace
metadata:
  name: zipkin
---
apiVersion: v1
kind: Service
metadata:
  name: zipkin
  namespace: zipkin
  labels:
    app: zipkin
spec:
  selector:
    app: zipkin
  ports:
    - port: 80
      targetPort: 9411
---
apiVersion: apps/v1
kind: Deployment
metadata:
  name: zipkin
  namespace: zipkin
  labels:
    app: zipkin
spec:
  selector:
    matchLabels:
      app: zipkin
  template:
    metadata:
      labels:
        app: zipkin
    spec:
      containers:
        - name: zipkin
          image: openzipkin/zipkin
          ports:
            - containerPort: 9411
          env:
            - name: STORAGE_TYPE
              value: "mem"
Dockerでの起動もお手軽。
Zipkin動作画面
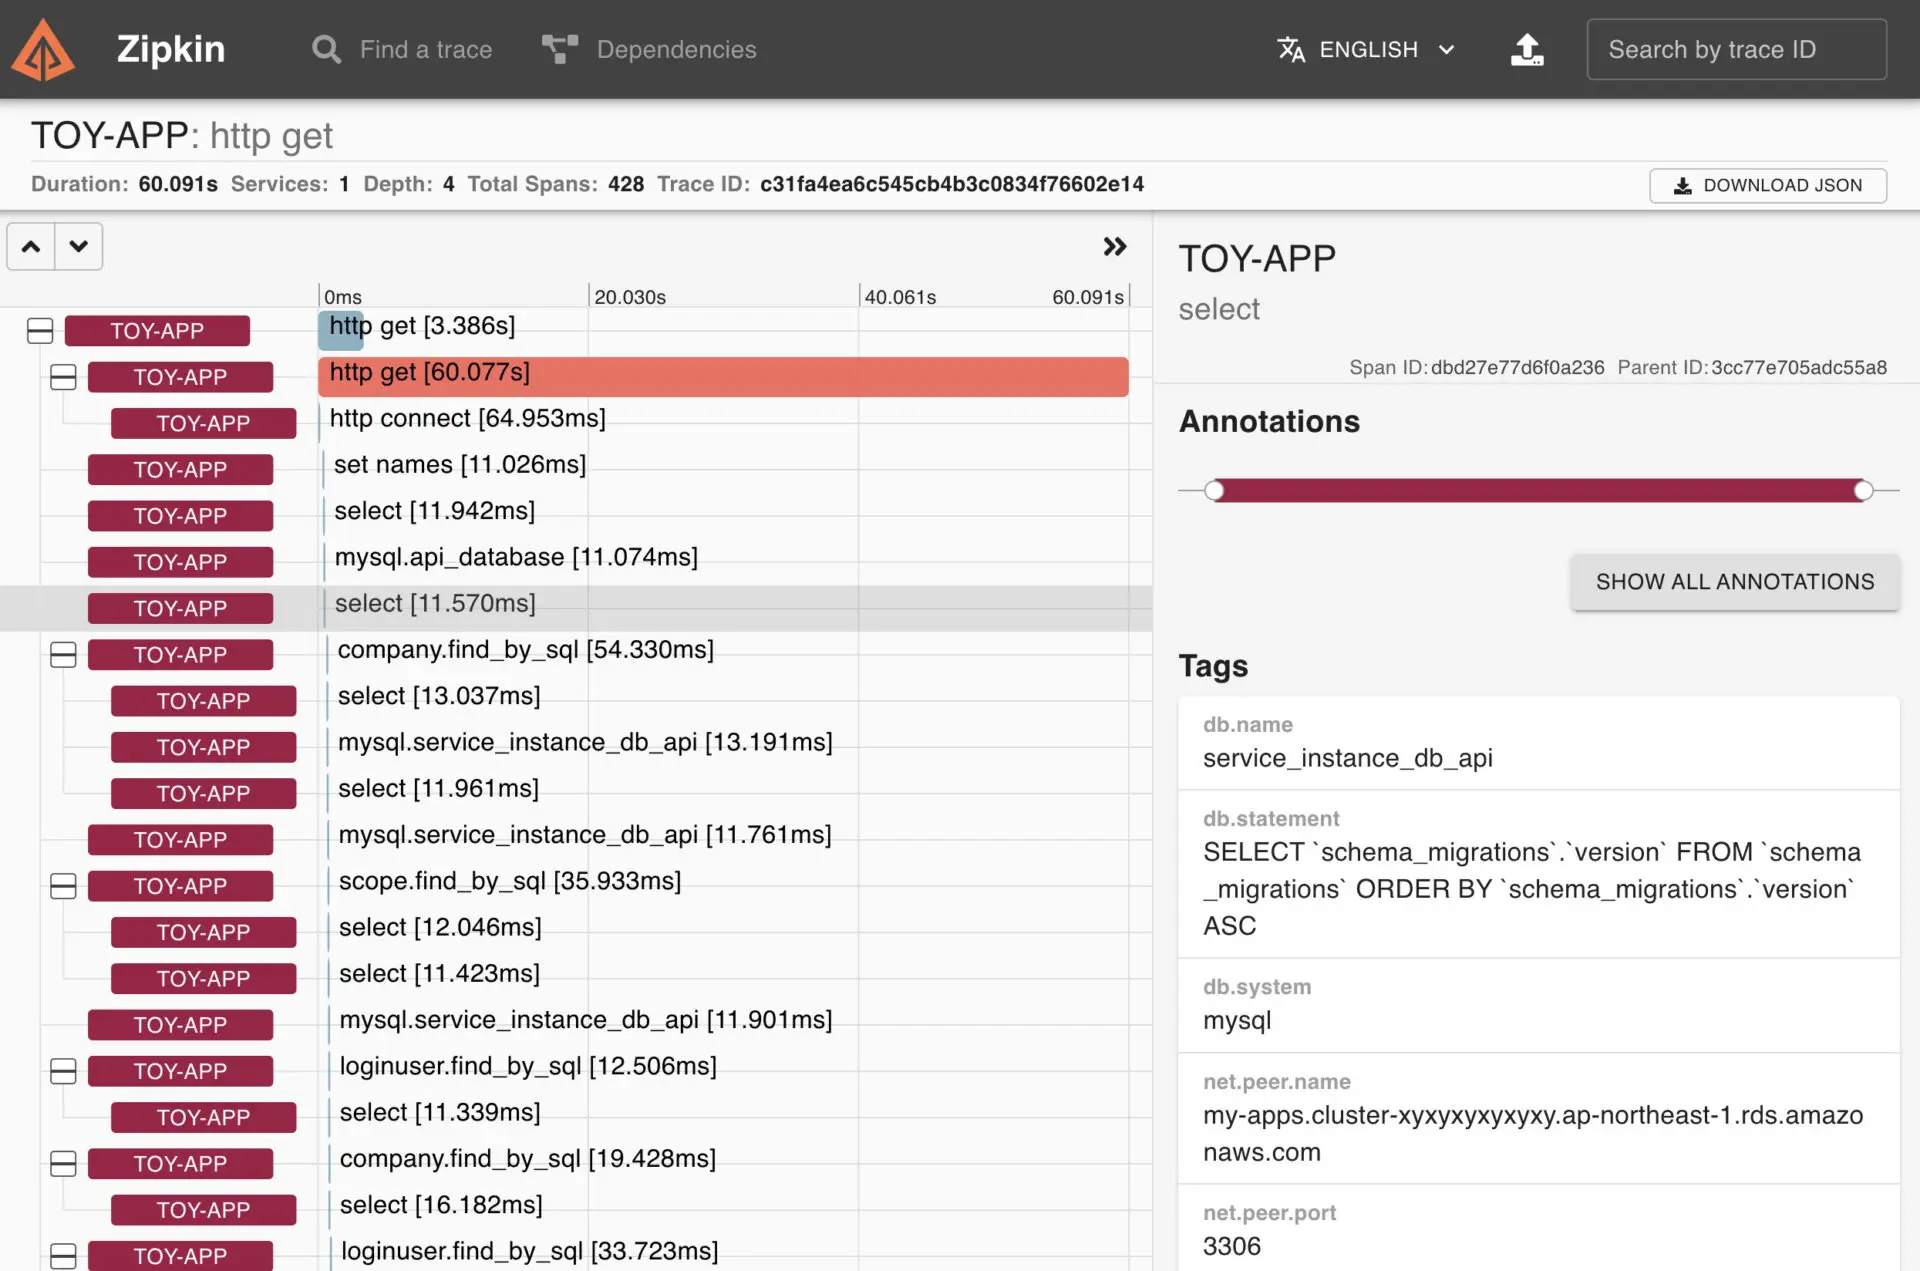
- この図では、最後の処理が60秒でタイムアウトを起こしている為えらく長いレンジになっている。
- そういえば、見たい幅を絞り込むためのUI部品が見当たらない。
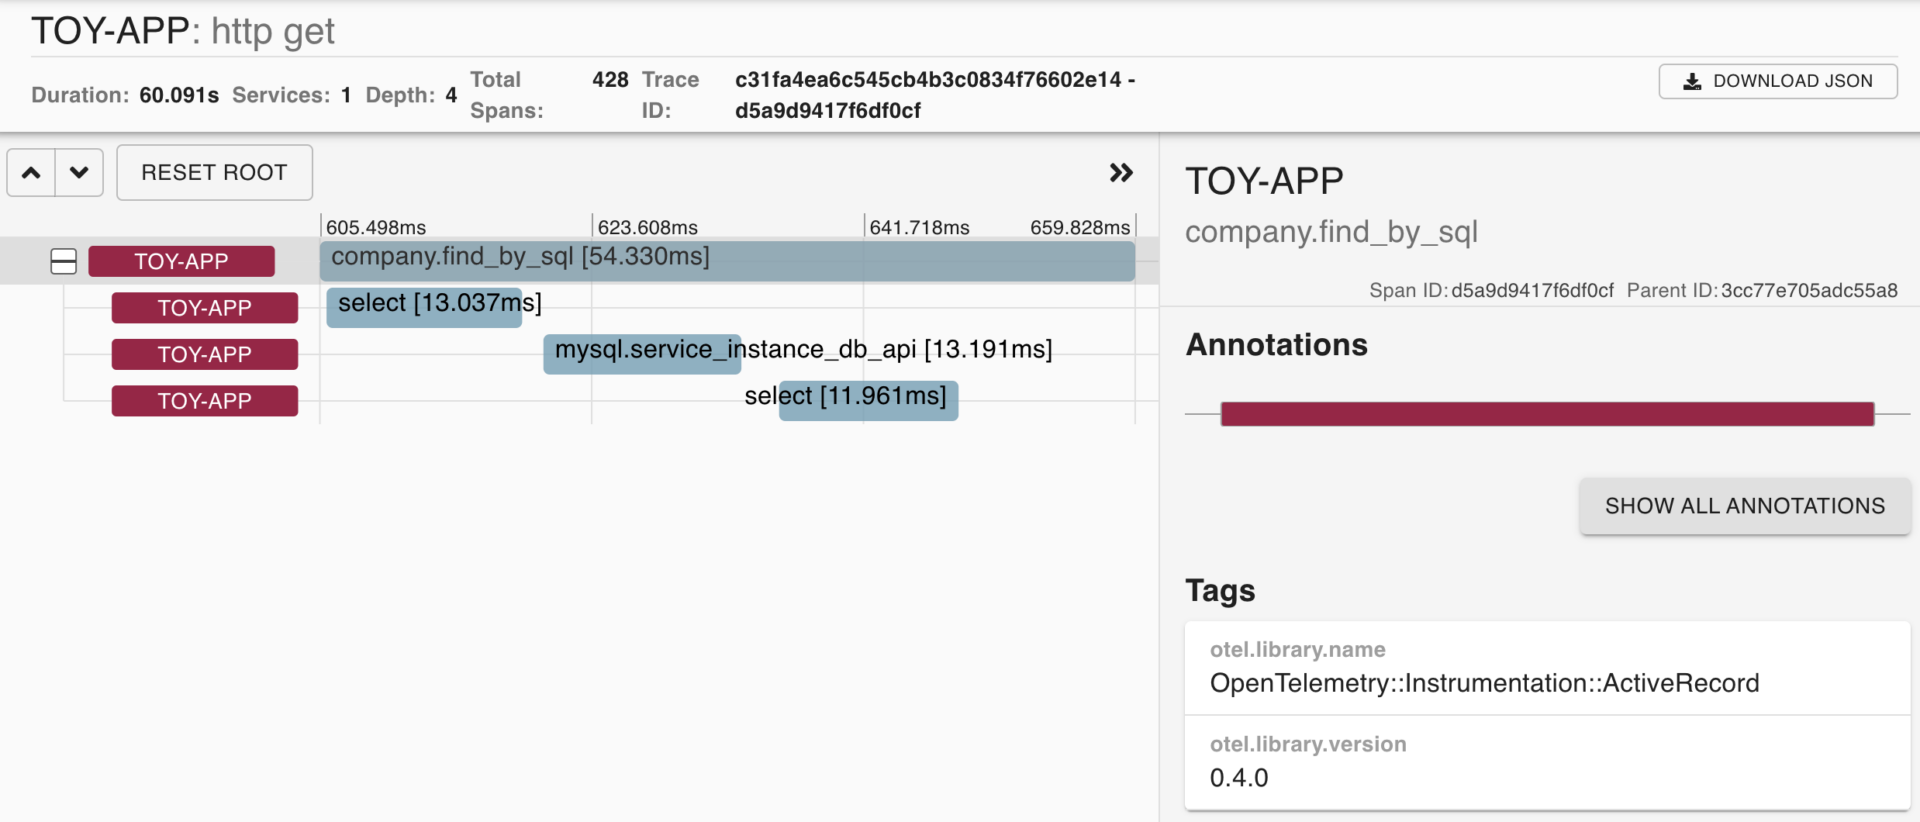
- ダブルクリックすることで部分的にドリルダウンしていくことはできる(下図)。
Zipkinのコンフィグ
お試し用のため、このような設定項目があるよという意図でコメントアウトだらけの整っていないコードですがそのまま掲載。
require 'opentelemetry/sdk'
require 'opentelemetry/instrumentation/all'
# require 'opentelemetry/exporter/otlp'
require 'opentelemetry/exporter/zipkin'

ENV['OTEL_TRACES_EXPORTER'] = 'zipkin'
# ENV['OTEL_SERVICE_NAME'] = 'zipkin-example'
# ENV['OTEL_SERVICE_VERSION'] = '0.15.0'

# ZIPKIN_ENDPOINT = 'https://zipkin.example.jp/api/v2/spans'
ZIPKIN_ENDPOINT = 'https://zipkin.example.jp'
OTEL_EXPORTER_ZIPKIN_ENDPOINT = ZIPKIN_ENDPOINT
# ENV['OTEL_EXPORTER_ZIPKIN_ENDPOINT'] = 'https://zipkin.example.jp/'

span_processor = OpenTelemetry::SDK::Trace::Export::BatchSpanProcessor.new(
  OpenTelemetry::Exporter::Zipkin::Exporter.new(endpoint: "#{ZIPKIN_ENDPOINT}/api/v2/spans" )
  # OpenTelemetry::Exporter::Zipkin::Exporter.new(endpoint: ZIPKIN_ENDPOINT )
)

OpenTelemetry::SDK.configure do |c|
  # c.service_name = 'zipkin-example'
  # c.service_version = '0.15.0'
  c.add_span_processor(span_processor)

  c.service_name = 'toy-app'
  # c.service_version = '0.1.0'

  c.use_all() # enables all instrumentation!  We should prune this down.
  ##### Instruments
  # c.use 'OpenTelemetry::Instrumentation::Rack'
  # c.use 'OpenTelemetry::Instrumentation::ActionPack'
  # c.use 'OpenTelemetry::Instrumentation::ActionView'
  # c.use 'OpenTelemetry::Instrumentation::ActiveJob'
  # c.use 'OpenTelemetry::Instrumentation::ActiveSupport'
  # c.use 'OpenTelemetry::Instrumentation::ActiveRecord'
  # c.use 'OpenTelemetry::Instrumentation::ConcurrentRuby'
  # c.use 'OpenTelemetry::Instrumentation::Faraday'
  # c.use 'OpenTelemetry::Instrumentation::HttpClient'
  # c.use 'OpenTelemetry::Instrumentation::Net::HTTP'
  # c.use 'OpenTelemetry::Instrumentation::Rails'
  # c.use 'OpenTelemetry::Instrumentation::Redis'
  # c.use 'OpenTelemetry::Instrumentation::RestClient'
  # c.use 'OpenTelemetry::Instrumentation::Sidekiq'
end
Zipkinのその他選択肢
zipkin-ruby というgemがある。軽く設定して動くことは確認。
いきなり OpenTelemetry を使うと、動かなかったときに Zipkin の問題なのか OpenTelemetry の問題なのかが区別つかずに苦労する。それに、今から新規で選ぶなら OpenTelemetry を使うべき?
openzipkin/zipkin-ruby: zipkin-tracer ruby gem
まとめ
初見で10分Quick Start の気分で手を付けたら、思いの外手間取ってしまいました。そして結局、使い慣れたAPMがいいなぁということで継続して触る気分にはなれず、中途半端な検証で終わりました。今後そのうちお世話になる気がします。
四苦八苦的な記録
AgentとかCollectorとか
OpenTelemetry のアーキテクチャの理解不足によるものですが、AgentとかCollectorとかがあるJaeger、そしていずれの区別もなく Exporter とだけまとまっている Zipkin など、ナニソレな感じでした。
span too large to send
UDPのプロトコル仕様による送信可能な最大長にひっかかっている様子?っぽい。
Collector を使うと HTTP になるので送ることができた。
![プロを目指す人のためのRuby入門[改訂2版]](https://images-na.ssl-images-amazon.com/images/P/4297124378.09.LZZZZZZZ.jpg)


![[Rails7] Guard LiveReload セットアップ時のエラー対処法 (Unable to load the EventMachine C extension)](/tcard/cd404e13-378f-4126-b88d-14ecee047b81/2022-05-09-cd404e13-378f-4126-b88d-14ecee047b81.webp)