先日は Helm および Helmfile の利用手順をまとめることを目的に Prometheus と Grafana のインストールをしましたが、この記事では Prometheus の導入方法に焦点をあてて情報整理をします。

この記事では以下の疑問に対して役立つ可能性があります。
- Kubernetes Operator や Prometheus Operator のことがよくわからないので概要を知りたい
- Kubernetes への Prometheus のインストール方法はどのような手段を用いるのがよいのか
- Grafana や Prometheus をとりあえず動かしたい
以下、詳細を記載します。
利用環境の前提
「Prometheus をインストールして Kubernetes メトリクスを取得する」と一言で表したとしても、Kubernetes 環境の構成そのものが多岐にわたりますので、どの構成がよいかは人それぞれであると言えます。この記事では以下の構成を前提に導入を検討します。
- GKE (Google Kubernetes Engine) で Kubernetes クラスタを構成している
- Kubernetes のワーカーノードは Preemptible VM (24時間で再生性される格安インスタンス) を利用している
Promeths セットアップ方法の概要
Prometheus の全体アーキテクチャは以下の通りです。Prometheus Server 単体だけでは目的を達成できないため、 Exporter と呼ばれる各種ミドルウェアのメトリクスデータを出力する機能(実装は小さなHTTPサービス)や、メトリクスデータを効率よく観測するための Grafana のセットアップ、その他オプションとして検知を通知するための Alertmanager などいくつかの構成要素があります。
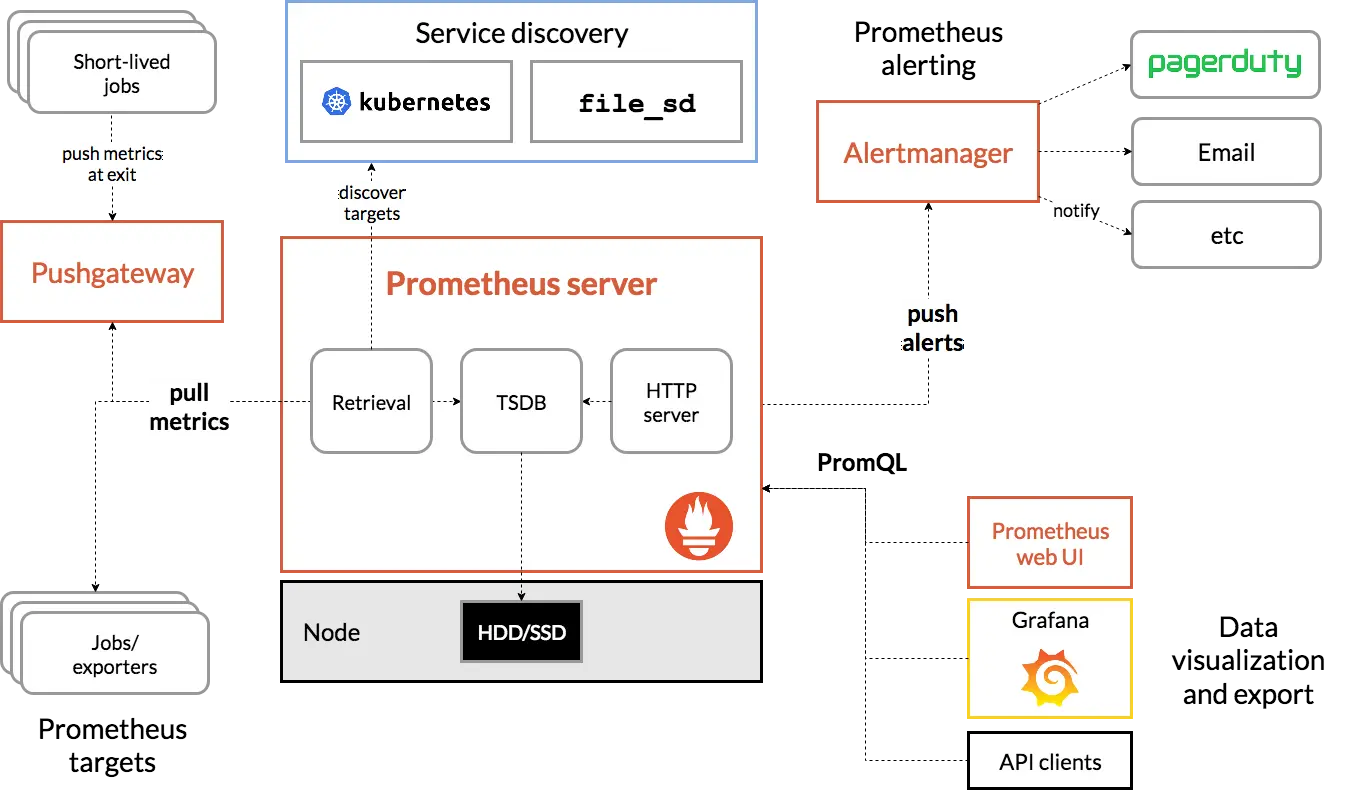
source: https://prometheus.io/docs/introduction/overview/
この Prometheus ですが、大きくは以下2通りのセットアップ手法があります。
- Deployment 等を用いた手動セットアップ
- Kubernetes Operator を用いた大部分が自動化されたセットアップ
更には Helm チャート利用の有無により構築パターンが分岐しますがこの記事ではそこには言及しません。手動セットアップの手順は以下のチュートリアル記事(外部リンク)が参考になります。
Prometheus Operator を利用したアーキテクチャ
Prometheus Operator を利用して構築する場合、下記のようなアーキテクチャになります。ServiceMonitor リソースでターゲットとなる Service を指定し、Prometheus Server は ServiceMonitor で定義されている Service からメトリクスを収集します。
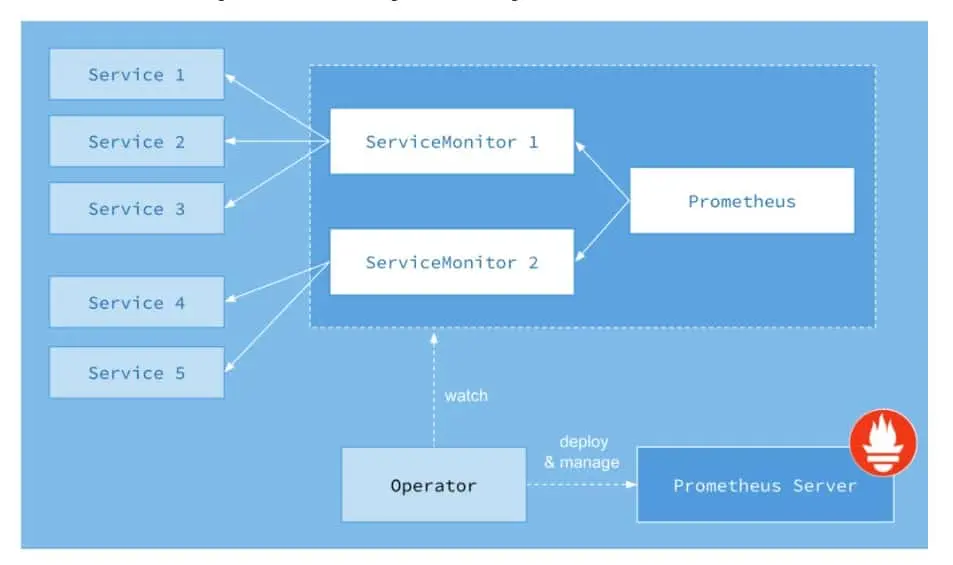
source: Prometheus definitive guide part III - Prometheus operator | Cloud Native Computing Foundation
Prometheus Operator を導入すると、これらのメトリクスを収集するための ServiceMonitor が標準で導入されます。その他、アプリケーションが出力 (Export) するメトリクスの収集は個別に ServiceMonitor をセットアップして収集することになります。
Prometheus Operator のサポートバージョン
Prometheus Operator を利用するうえでは、Kubernetes クラスタとの互換性も考慮しておく必要があります。
Prometheus Operator に はオペレータ本体の開発に使われているリポジトリ( prometheus-operator )と、開発した prometheus-operator を導入するリポジトリ( kube-prometheus )があります。
Prometheus Operator: The Prometheus Operator uses Kubernetes custom resources to simplify the deployment and configuration of Prometheus, Alertmanager, and related monitoring components.
kube-prometheus: kube-prometheus provides example configurations for a complete cluster monitoring stack based on Prometheus and the Prometheus Operator. This includes deployment of multiple Prometheus and Alertmanager instances, metrics exporters such as the node_exporter for gathering node metrics, scrape target configuration linking Prometheus to various metrics endpoints, and example alerting rules for notification of potential issues in the cluster.
helm chart: The prometheus-community/kube-prometheus-stack helm chart provides a similar feature set to kube-prometheus. This chart is maintained by the Prometheus community. For more information, please see the chart’s readme
Prometheus Operator だけだと運用には物足りませんので、実用上は Complete cluster monitoring stack と書かれている kube-promehtues を利用することになります。kube-prometheus はサポートするバージョンの対応表が公式のドキュメントにありますので参照してください。
例えば 2022/11/20 現在は以下の通り互換性が定義されています。
| kube-prometheus stack | Kubernetes 1.20 | Kubernetes 1.21 | Kubernetes 1.22 | Kubernetes 1.23 | Kubernetes 1.24 |
|---|---|---|---|---|---|
release-0.8 | ✔ | ✔ | ✗ | ✗ | ✗ |
release-0.9 | ✗ | ✔ | ✔ | ✗ | ✗ |
release-0.10 | ✗ | ✗ | ✔ | ✔ | ✗ |
release-0.11 | ✗ | ✗ | ✗ | ✔ | ✔ |
main | ✗ | ✗ | ✗ | ✗ | ✔ |
Kubernetes (Prometheus) Operator を使うべきなのか問題
ここまでで何度も Operator という単語が出てきますが、そもそも Operator とは何なのでしょうか。CNCF (Cloud Native Computing Foundation) のサイトにまとまっていました。
まず Kubernetes Operator はなにかというと、Custom Resource Definition (CRD), Custom Resource (CR), Custom Controller を用いて Kubernetes の機能を拡張し、複雑なアプリケーションの導入や運用などを自動化する “優れたサービスのデプロイ方法” を提供してくれる仕組みです。
そして Prometheus Operator は、Kubernetes Operator の仕組みを利用して、Prometheus サーバーや Alertmanager 及びそれら構成ファイルを自動的にマネージしてくれる方法を提供してくれる仕組みということです。特徴は以下の通りまとめられています。
Automation: Easily launch a Prometheus instance for your Kubernetes namespace, a specific application, or a team.
Service discovery: Automatically discover the targets to be monitored using familiar Kubernetes label queries; without a need to learn a Prometheus specific configuration language.
Easy Configuration: Manage the configuration of the essential resources of Prometheus like versions, persistence, retention policies, and replicas from a Kubernetes resource.
従って、これから Prometheus を Kubernetes へ新規デプロイするならば積極的に利用したほうがよいと言えそうです。(但し、前述の通り抽象化要素が増えることで Kubernetes クラスタバージョンとの互換性考慮の手間も発生します)
ここまで書いておいてなんですが、 Prometheus Operator を利用した kube-prometheus と Helm Chat は similar feature と書かれていますし、 Helm Chart のメンテナンスも Prometheus コミュニティーで行われていますので、機能面では同等の内容を得られるでしょう。そうなるとあとは、Kubernetes 環境の運用チームが使い慣れているお作法 (Operator あるいは Helm Chart) で技術選択するのがよいのかもしれません(Helm Chart でも、Operator を用いているものと用いていないものがあるので、確認が必要です)。
インストール
ここまで整理の結果、Operator を用いてセットアップしてくれる Helm Chart による環境構築を行います。やることの意味は以下の通りですが、本記事では Helmfile を用いて構成管理をするので、今ここではコマンドは実行しません。
# 後のステップで Helmfile により実行するので、現時点はこのコマンドは実行しません

helm repo add prometheus-community https://prometheus-community.github.io/helm-charts

helm repo update

helm install prometheus prometheus-community/kube-prometheus-stack
kube-prometheus-stack を利用することで以下のコンポーネントをインストールします。
- Prometheus Operator
- Prometheus Server、Alertmanager、および関連する Custom Resource群
- Node Exporter
Helmfile で Prometheus Stack をインストール
2022/11/20現在のバージョンは kube-prometheus-stack-41.9.1 でした。
helmfile.yaml を作成して、その後に helmfile コマンドでサーバーへデプロイします。Helmfile コマンドをインストールしていない場合は先にインストールしてください。(手順は以下記事参照:再掲)
以降のインストール手順では、 「observability 」という名前の Namespace にインストールする手順で記載しています。
# helmfile.yaml
repositories:
 - name: prometheus-community
   url: https://prometheus-community.github.io/helm-charts

releases:
  - name: prometheus
    namespace: observability
    chart: prometheus-community/kube-prometheus-stack
# インストールコマンドを実行
$ helmfile apply --skip-diff-on-install
Adding repo prometheus-community https://prometheus-community.github.io/helm-charts
"prometheus-community" has been added to your repositories
Listing releases matching ^prometheus$
Upgrading release=prometheus, chart=prometheus-community/kube-prometheus-stack
Release "prometheus" does not exist. Installing it now.
NAME: prometheus
LAST DEPLOYED: Sun Nov 20 17:56:14 2022
NAMESPACE: observability
STATUS: deployed
REVISION: 1
NOTES:
kube-prometheus-stack has been installed. Check its status by running:
kubectl --namespace observability get pods -l "release=prometheus"
Visit https://github.com/prometheus-operator/kube-prometheus for instructions on how to create & configure Alertmanager and Prometheus instances using the Operator.
Listing releases matching ^prometheus$
prometheus observability 1 2022-11-20 17:56:14.336092 +0900 JST deployed kube-prometheus-stack-41.9.1 0.60.1
UPDATED RELEASES:
NAME CHART VERSION
prometheus prometheus-community/kube-prometheus-stack 41.9.1helmfile apply --skipdiff-on-install のあと、以下のコマンドにより Grafana や Prometheus の Pod が起動していれば成功です。
kubectl --namespace observability get pods,svc,deployサービスへのアクセス方法
この時点では Service や Pod が作成されたまでであり、外部への公開はされていません。サービスへアクセスするには以下の方法があります。
kubectl port-forwardによりポートフォワードして localhost でアクセスする- Pod 名の取得も含めて使い回せる一行コマンドにしています。おそらく汎用的になっていますが、Pod名のバリエーションを完全に把握しているわけではないので
grepでマッチしない可能性があります。その場合は、get podをして名前を確認してください。 - Prometheus (
localhost:9090):kubectl -n observability port-forward $(kubectl -n observability get pod | grep prometheus-kube-prometheus-prometheus | awk '{print $1}') 9090:9090 - Grafana (
localhost:3000):kubectl -n observability port-forward $(kubectl -n observability get pod | grep prometheus-grafana | awk '{print $1}') 3000:3000
- Pod 名の取得も含めて使い回せる一行コマンドにしています。おそらく汎用的になっていますが、Pod名のバリエーションを完全に把握しているわけではないので
- Ingress をセットアップして外部から HTTP(S) でアクセスできるようにする
- Grafana へのアクセスは Ingress では以下の通りルール設定すればアクセス可能です。
- Prometheus 本体には外部からアクセスする必要性(頻度)が低いでしょうから、必要な都度 Port Forward としたほうが余計なセキュリティリスクを排除できて好ましいと思います。
rules:
  - http:
      paths:
      - path: /
        pathType: Prefix
        backend:
          service:
            name: prometheus-grafana
            port:
              number: 80
Grafana の Admin パスワード
Grafana の Admin パスワードの初期値は Secret に保存されているため、以下のコマンドで取得します。
kubectl --namespace observability get secret prometheus-grafana -ojsonpath='{.data.admin-password}' | base64 -d -補足事項
helmfile apply ではなく、 --skip-diff-on-install オプションを付与しています。理由は次の通り helmfile apply するとコケました。
Error: unable to build kubernetes objects from release manifest: [resource mapping not found for name: "prometheus-kube-prometheus-alertmanager" namespace: "observability" from "": no matches for kind "Alertmanager" in version "monitoring.coreos.com/v1"
ensure CRDs are installed first, resource mapping not found for name: "prometheus-kube-prometheus-prometheus" namespace: "observability" from "": no matches for kind "Prometheus" in version "monitoring.coreos.com/v1"
...
helmfile apply とあわせて内部的には helm diff コマンドが実行されますが、この時点では Prometheus Operator がインストールされていないので、あらゆるリソースとの Diff に失敗するためです。CRDs がなければ話にならないため、初回は helmfile apply --skip-diff-on-install とオプションをつけると Diff の処理をスキップします。
--skip-diff-on-install Skips running helm-diff on releases being newly installed on this apply. Useful when the release manifests are too huge to be reviewed, or it's too time-consuming to diff at all0データの永続化
Prometheus と Grafana のインストールが完了し、サービスにアクセスできるようになりました。しかし、今の状態は Pod を再起動したらデータが消失しています。試しに以下のコマンドで Prometheus を削除してみましょう。
まずは削除する前に、以下のコマンドでCPU使用率を表示してみます。何らかのグラフが表示されるでしょう。
http://localhost:9090/graph?g0.expr=rate(node_cpu_seconds_total[1m])&g0.tab=0&g0.stacked=0&g0.show_exemplars=0&g0.range_input=1h
そしてPodを削除します。数秒でPodが再作成され、アクセスできるようになります。
kubectl delet pod $(kubectl -n observability get pod | grep prometheus-kube-prometheus-prometheus | awk '{print $1}')改めて上記リンクを表示してみると、先程表示されたグラフが全くなくなっていることがわかります。このままでは実用的ではありません。
Prometheus データ永続化の設定方法
helmfile.yaml の修正 ( ./values.yaml の参照 )と、 values.yaml ファイルの新規作成をします。
repositories:
 - name: prometheus-community
   url: https://prometheus-community.github.io/helm-charts

releases:
  - name: prometheus
    namespace: observability
    chart: prometheus-community/kube-prometheus-stack
    values:
- ./values.yamlprometheus:
prometheusSpec:
storageSpec:
volumeClaimTemplate:
spec:
storageClassName: standard # 自身の環境に応じて設定
accessModes: ["ReadWriteOnce"]
resources:
requests:
storage: 5Gi
# Failed to provision volume with StorageClass "standard": claim.Spec.Selector is not supported for dynamic provisioning on GCE
# selector: {}コメント欄に空きましたが、 selector を指定すると環境にエラーが出る場合はコメントアウトします。(調べた感じ、少なくともGCEやAWSでは出るような記載を見かけました)
作成したら helmfile コマンドでデプロイします。
# 変更差分を事前確認。 storage: 部分が更新されているはず
helmfile diff

# 期待する差分であれば、Kubernetes クラスタへ適用する
helmfile apply
Volume 設定前
$ kubectl -n observability describe pod $(kubectl -n observability get pod | grep prometheus-kube-prometheus-prometheus | awk '{print $1}')

...
Volumes:
  ...
  prometheus-prometheus-kube-prometheus-prometheus-db:
    Type:       EmptyDir (a temporary directory that shares a pod's lifetime)
    Medium:
    SizeLimit:  <unset>
Volume 設定後
$ kubectl -n observability describe pod $(kubectl -n observability get pod | grep prometheus-kube-prometheus-prometheus | awk '{print $1}')

...
Volumes:
  ...
  prometheus-prometheus-kube-prometheus-prometheus-db:
    Type:       PersistentVolumeClaim (a reference to a PersistentVolumeClaim in the same namespace)
    ClaimName:  prometheus-prometheus-kube-prometheus-prometheus-db-prometheus-prometheus-kube-prometheus-prometheus-0
    ReadOnly:   false
Grafana データ永続化の設定方法
Grafana は Prometheus とは異なる設定構文です。というのも、 kube-prometheus-stack の Grafana は別レポジトリの Grafana Chart にパスしているためのようです。
Grafana Chart で設定可能なコンフィグは以下に記載があります。導入時期によりコンフィグの変化があるかもしれませんので、利用するバージョンとの関係性をチェックしてください。
values.yaml
# Prometheus と同じファイルに追記します
grafana:
  persistence:
    type: pvc
    enabled: true
    storageClassName: standard  # 自身の環境に応じて設定
    accessModes:
      - ReadWriteOnce
    size: 500Mi
    finalizers:
      - kubernetes.io/pvc-protection
Volume 設定前
Volumes:
  storage:
    Type:       EmptyDir (a temporary directory that shares a pod's lifetime)
    Medium:
    SizeLimit:  <unset>
  sc-dashboard-volume:
    Type:       EmptyDir (a temporary directory that shares a pod's lifetime)
    Medium:
    SizeLimit:  <unset>
  sc-datasources-volume:
    Type:       EmptyDir (a temporary directory that shares a pod's lifetime)
    Medium:
    SizeLimit:  <unset>
Volume 設定後
Volumes:
  storage:
    Type:       PersistentVolumeClaim (a reference to a PersistentVolumeClaim in the same namespace)
    ClaimName:  prometheus-grafana
    ReadOnly:   false
  sc-dashboard-volume:
    Type:       EmptyDir (a temporary directory that shares a pod's lifetime)
    Medium:
    SizeLimit:  <unset>
  sc-datasources-volume:
    Type:       EmptyDir (a temporary directory that shares a pod's lifetime)
    Medium:
    SizeLimit:  <unset>
Grafanaの永続Volume設定前に admin パスワード変更等を実施しても、Podの再起動でもとに戻ってしまうので注意してください。
可視化の設定
データの取得環境(Prometheus)とグラフでの可視化環境(Grafana)が整ったので、あとは PromQL を用いてコツコツとグラフ作成をしていきます。
この記事は環境構築までで一旦終了します。
まとめ
Kubernetes Operator (Prometheus Operator) を利用して Prometheus と Grafana のインストールを行いました。Helmで操作しているので、Operator を使わないパターンとの差を、ここまでの手順で実感することはありませんでした。ですが、以降の手順では ServiceMonitor リソースが登場するなどで Operator の恩恵を実感できるのではないかと思います。
やはり Helmfile がなかなか良いですね。 helmfile diff からの helmfile apply の一例の流れがお気に入りです。
その他参考情報
Prometheus クエリ (PromQL)
PromQL をたまにしか使わないと、どのキーで何の値を取得できるのかで悩みがちですね。Prometheus での取得確認はもちろん、Grafana でのグラフ作成の際に必要な構文ですので、利用頻度が高いものはある程度パターン化しておきたいところです。
| やりたいこと | PromQL クエリ例 |
|---|---|
| CPU使用率(ユーザー)の取得 | rate(node_cpu_seconds_total{mode="user"}[1m]) |
| Pod ごとのCPU使用率の取得 | sum(rate(container_cpu_usage_seconds_total[5m])) by (pod) |
ServiceMonitor の作成
A ServiceMonitor lets us create a job entry in
scrape_configin an easier Kubernetes-native way. Internally Prometheus Operator translates the configuration from each ServiceMonitor resource to prometheus.yaml’sscrape_configsection.
Prometheus definitive guide part III - Prometheus operator | Cloud Native Computing Foundation
ServiceMonitor 内部的には scrape_config に変換されるアーキテクチャのようです。scrape_config をKubernetes ネイティブで構成管理するための記法のようですね。
Ingress のセットアップ
この手順では Ingress ファイルを別に作成しましたが、 kube-prometheus-stack の設定 (values) にも値があるので設定できそうです。今回は自身のリソース管理方法の都合により Ingress ファイルだけ別にしたかったので外部から設定しました。Stack に含まれる設定値は以下の通りです。


![[Kubernetes] Prometheus MySQL Exporter インストール方法](/tcard/cecde373-ca85-46a7-b944-faae23d9e279/2022-11-23-cecde373-ca85-46a7-b944-faae23d9e279.webp)
![[GKE] サービスアカウントとサービスアカウントを連携する - Workload Identity](/tcard/b26834f1-78de-445a-8d28-74d43fe6625a/2022-11-18-b26834f1-78de-445a-8d28-74d43fe6625a.webp)