過去記事(*1)で一度は敬遠した Helm ですが、度々 Helm チャートでしか提供していないソフトウェアに出会うのでやむを得ず再学習しました。改めて使ってみると当時嫌だと思っていたことが解消されていて、だいぶ使いやすくなった印象でした。この記事では、Helm および Helmfile を利用して、 Prometheus と Grafana のセットアップを題材に利用方法の概要を説明します。
(*1)過去記事 https://fand.jp/upgrade-cert-manager-without-helm/
改めてHelmを利用するにあたっての向き合い方
当時嫌だったのは、利用頻度の高くないツールを使うことでの学習コストでした。
- Tiler という名のリソースが Kubernets クラスタ内にある =いつかアップデートする必要があり構成管理の手間が増加する
helm repo add package https://...など、helmコマンドを手順として整理しておかなければならない- インストールの際にも
helmの引数でいくつかのパラメタを書かなければならない
率直に言ってしまえば面倒くさかっただけです。
かたや、 Helm バージョン3 では Tiller が取り除かれたようなのです!
コミュニティメンバーの特定のシナリオ下での Helm の使い方について調査をした結果、Tiller のリリース管理システムがステートを保持して Helm のリリース情報のセントラルハブとして動作するためには、クラスタ内のオペレータに依存する必要はなかったことがわかりました。
Tiller の主目的は Tiller がなくても実現できたことがわかったため、Helm 3 に関して私たちが下した最初の決定は Tiller を完全に取り除くことでした。
https://helm.sh/ja/docs/faq/
加えて、後述する Helmfile というツールを利用することで Helm の構成管理もシンプル化され(YAMLファイルへ集約できるため宣言的になり)、当初の悩みの種がだいぶ軽減されていました。
以降のセクションでは、 Helmfile を利用して Helm チャートのインストールを試していきます。
事前準備
Helm の歴史的経緯の理解が不十分なため、「それもともと Helm でもできてたよ」といった内容があるかもしれませんがご容赦ください。
macOS へのセットアップの説明です。3つのコマンドをインストールします。
# 1. helm コマンドのセットアップ
brew install helm

# 2. helm のプラグイン(サブコマンド). helm diff が使えるようになる
helm plugin install https://github.com/databus23/helm-diff

# 3. helmfile のセットアップ
brew install helmfile

# completion を設定しておくと便利(任意)
# 自動適用したければ ~/.zshrc へ記載
source <(helm completion zsh)
helm diff コマンドは、Kubernetes クラスタへインストールしようとしているリソース(チャート)の中身を差分表示してくれるようです。変更しようとしている内容が正しいかのチェックを手助けしてくれます。
helm diff のサブコマンド
Usage:
  diff [flags]
  diff [command]

Available Commands:
  completion  Generate the autocompletion script for the specified shell
  release     Shows diff between release's manifests
  revision    Shows diff between revision's manifests
  rollback    Show a diff explaining what a helm rollback could perform
  upgrade     Show a diff explaining what a helm upgrade would change.
  version     Show version of the helm diff plugin
各ツールの公式サイトは以下の通り。
Helmfile を用いた作業ステップ
- 構成ファイル
yamlを準備する helmfile applyを実行する
たったこれだけです!この記事では Prometheus と Grafana のセットアップを例にコンフィグを記載しますが、初見でも内容がなんとなく想像できますね。 helm repo add として別にコマンドを叩いていた内容も YAML で定義できます。
なおこの記事では、 observability という名前の namespace を利用していますが、任意のパラメタなので各自の環境に読み替えてください。
ディレクトリ構成
.
├── helmfile.yaml      <--- helmfile (1)
├── grafana
│   ├── helmfile.yaml  <--- helmfile (2)
│   └── values.yaml
└── prometheus
    ├── helmfile.yaml  <--- helmfile (3)
    └── values.yaml
helmfile.yaml が3つ登場しますが、 helmfile (1) では配下の helmfile.yaml を呼び出しているだけです。
helmfiles:
  - ./prometheus/helmfile.yaml
  - ./grafana/helmfile.yaml
Grafana の 構成ファイル
grafana/helmfile.yaml
レポジトリの指定もこのYAMLに記載できるので構成管理しやすいですね。
repositories:
 - name: grafana
   url: https://grafana.github.io/helm-charts

releases:
  - name: grafana
    namespace: observation
    chart: grafana/grafana
    values:
      - ./values.yaml
grafana/values.yaml
カスタマイズしたいパラメタを指定します。適用可能なパラメタはそれぞれの Chart によりますのでドキュメントを参照してください。
service:
  port: 8080
Prometheus の 構成ファイル
repositories:
 - name: prometheus-community
   url: https://prometheus-community.github.io/helm-charts

releases:
  - name: prometheus
    namespace: observation
    chart: prometheus-community/prometheus
    values:
- ./values.yamlalertmanager:
enabled: false
kubeStateMetrics:
enabled: false
pushgateway:
enabled: false構築
最後に helmfile apply を実行します。参考情報として実行ログ全てを掲載しますが非常に膨大なため、記事の最後に貼り付ける形とします。
まとめると「YAMLファイルを書く」「コマンドを1個 (helmfile apply)を叩く」の2ステップで完結してしまいました。余計な手順書を作る必要もなく済みそうです。
helmfile の実行においては、最終的には helm コマンドへ移譲しているとの説明があります。
To avoid upgrades for each iteration of
helm, thehelmfileexecutable delegates tohelm- as a result,helmmust be installed.
より発展的な使い方
本記事では言及しませんが、 environments キーを利用して環境ごと( production, dev, staging など)の構成ファイルを区別する使い方もできます。 GitOps 的な構成管理がしやすそうですね。
構築サンプル
以降の説明は helm や helmfile とは無関係ですが、いかにスムーズに構築が終わったのかを示す一例として、ついでに操作してみます。
この構築では Ingress をセットアップしていないので外部ネットワークへは公開されていません。そのため、Prometheus と Grafana それぞれの表示確認は kubectl port-forward を利用してローカルホストでアクセスできるようにしています。
Prometheusサンプル
実行ログに記載荒れている通りなのですが、以下のコマンドでポートフォワードを開始できます。ターミナルでコマンドを叩いた後、ブラウザで http://localhost:9090/ へアクセスしましょう。
export POD_NAME=$(kubectl get pods --namespace observation -l "app=prometheus,component=server" -o jsonpath="{.items[0].metadata.name}")
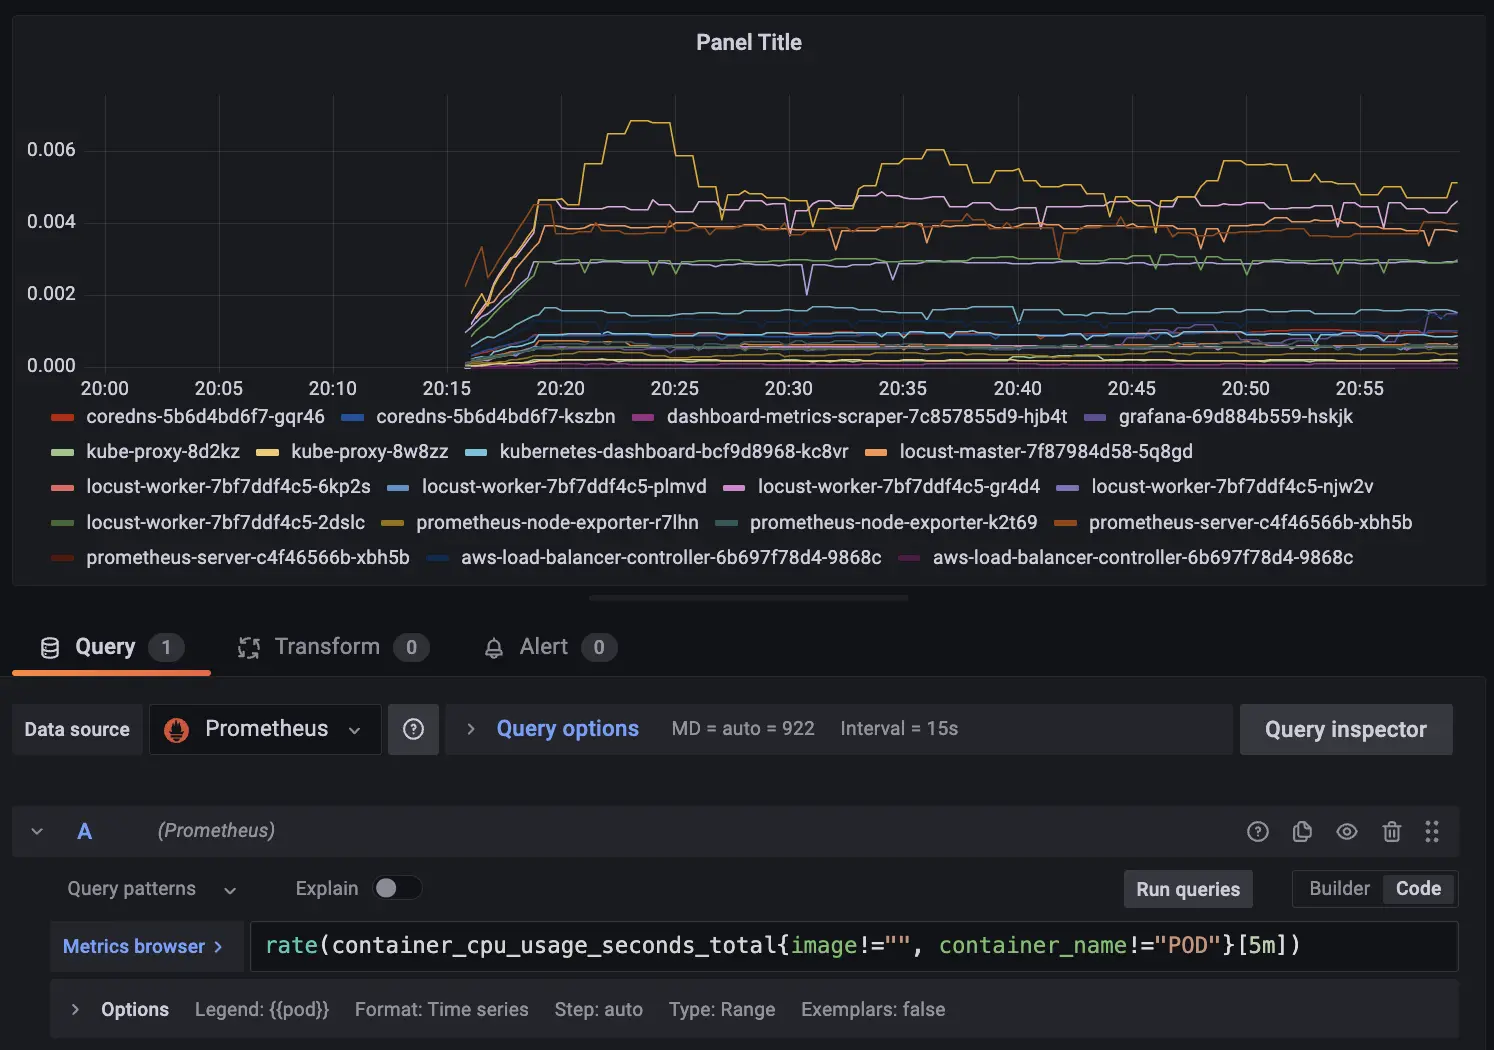
kubectl --namespace observation port-forward $POD_NAME 9090以下の通り、Prometheus および Kubernetes ワーカーノードで配置した Node Exporter 等のデータが収集されています。コンテナ(Pod)のメトリクスも取得できていました。(以下はCPU使用率の取得例)
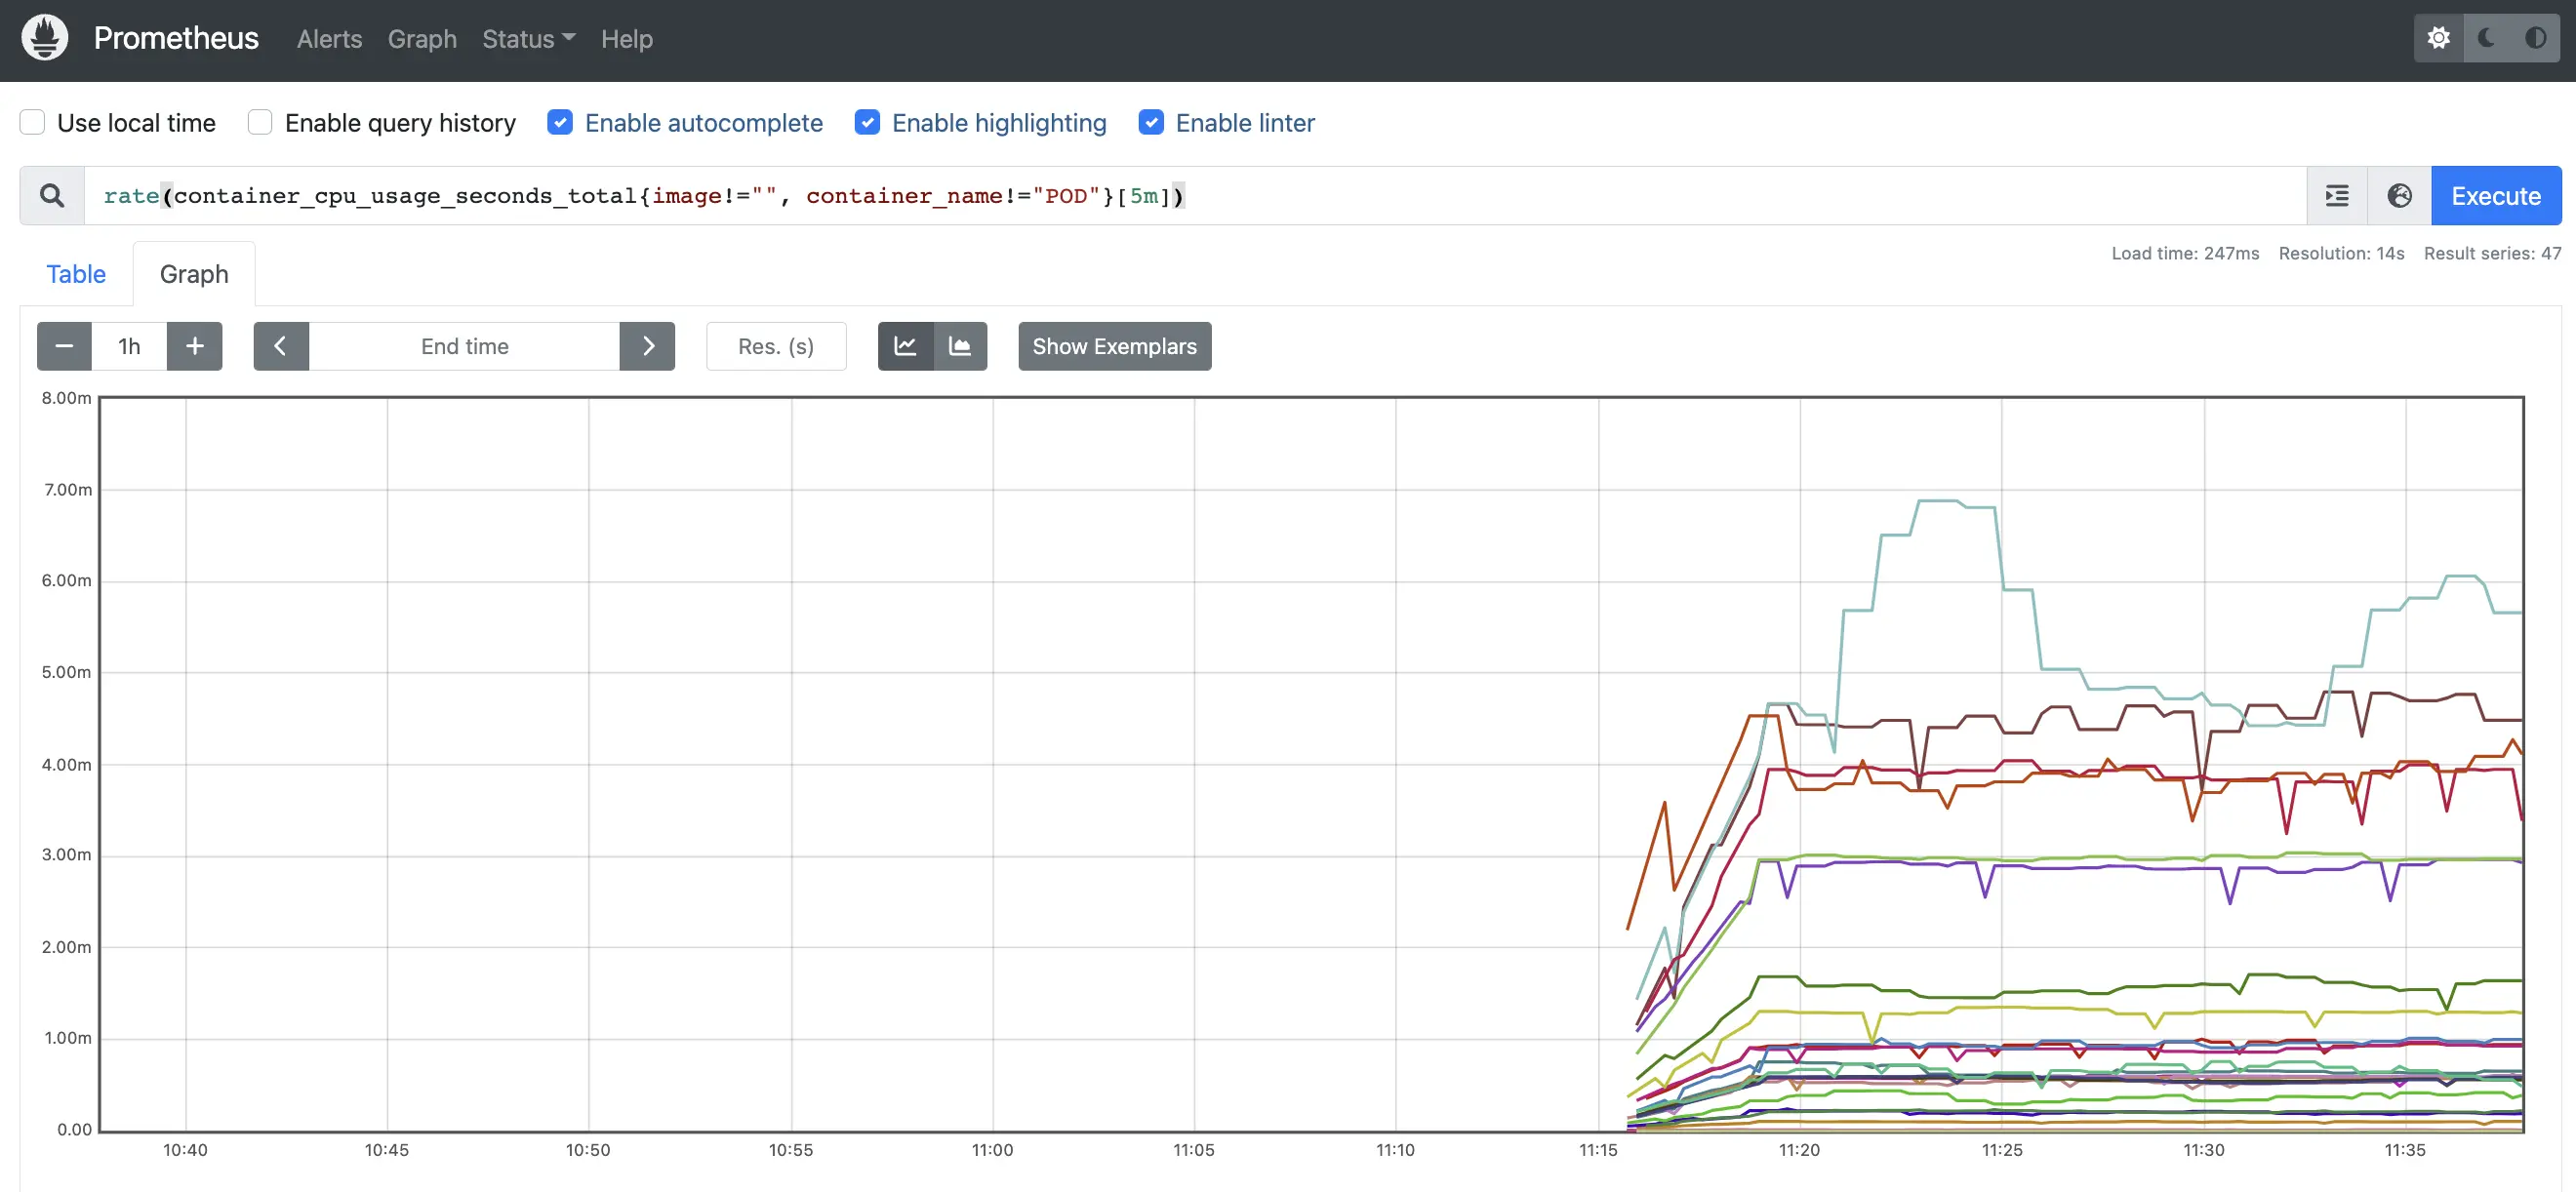
なお、数字の単位 m については、以下の通り millcpu を指しています。
コンテナのリソース管理 | Kubernetes
0.1という表現は100mという表現と同等であり、100ミリCPUと読み替えることができます。100ミリコアという表現も、同じことを意味しています。0.1のような小数点のある要求はAPIによって100mに変換され、1mより細かい精度は許可されません。 このため、100mの形式が推奨されます。
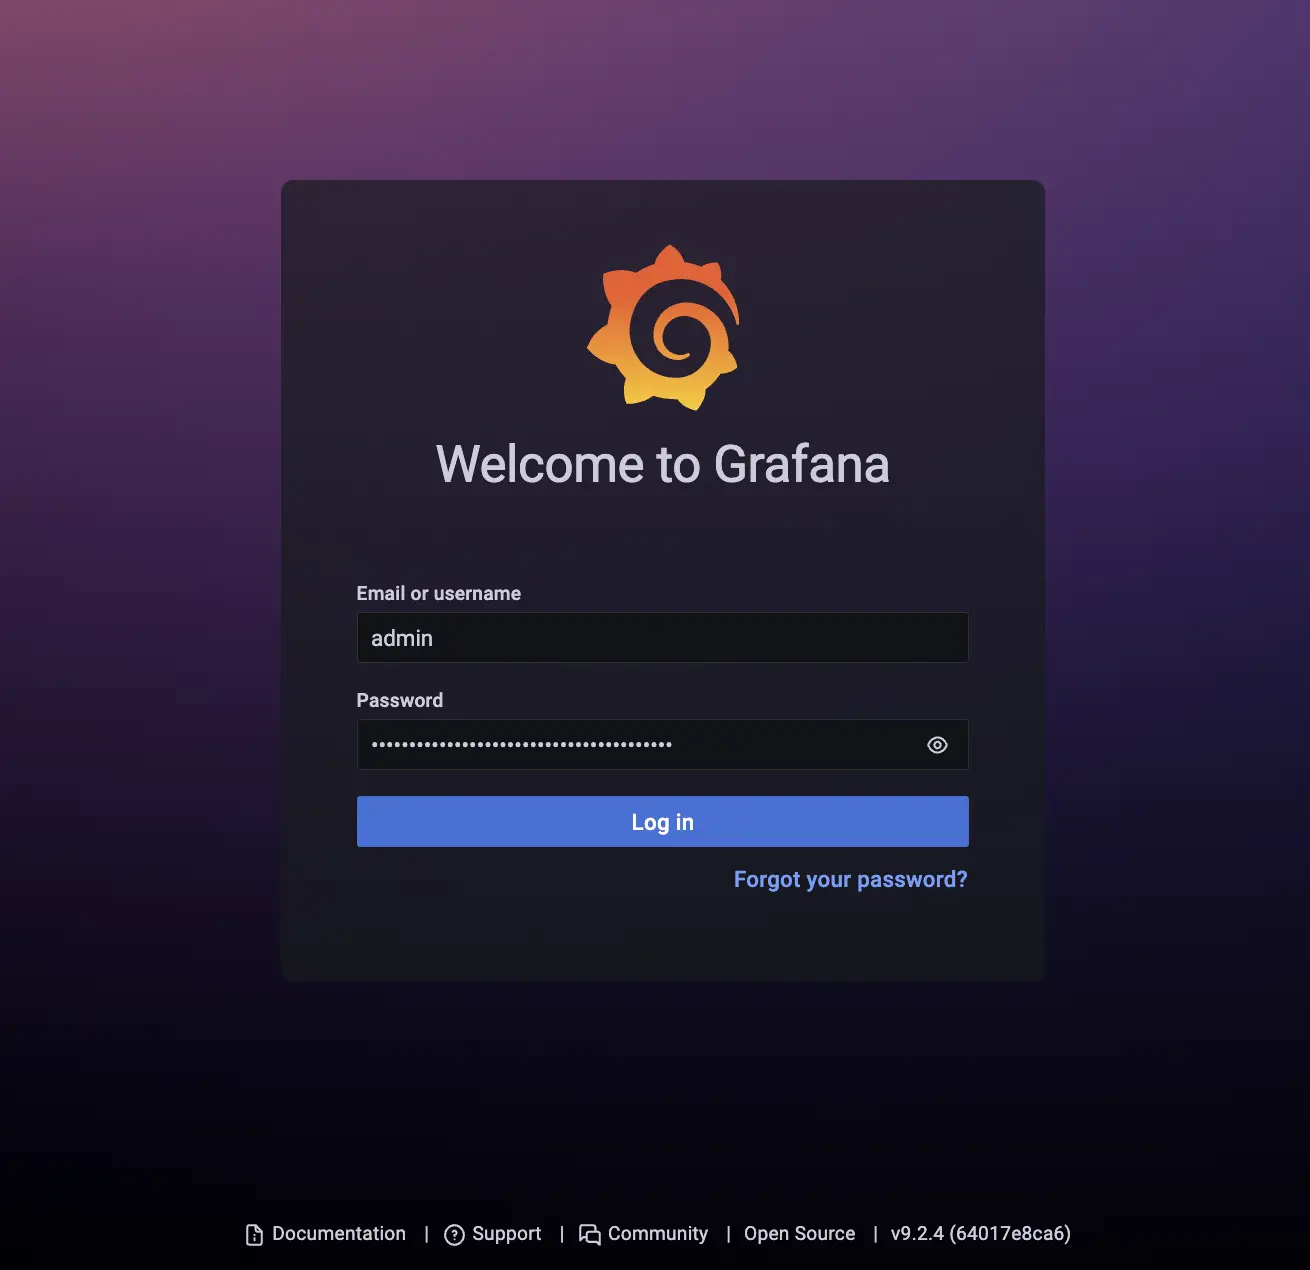
Grafana サンプル
Grafana も Prometheus と同様の手順でポートフォワードし、 http://localhost:3000 へアクセスします。これに加えて Grafana では admin ユーザーのパスワードが自動生成されているので、それをコマンドで取得します。
# Get the Grafana URL to visit by running these commands in the same shell:
export POD_NAME=$(kubectl get pods --namespace observation -l "app.kubernetes.io/name=grafana,app.kubernetes.io/instance=grafana" -o jsonpath="{.items[0].metadata.name}")
kubectl --namespace observation port-forward $POD_NAME 3000
# Get your 'admin' user password by running:
kubectl get secret --namespace observation grafana -o jsonpath="{.data.admin-password}" | base64 --decode ; echoこのようにランダムに生成されたパスワードが表示されます: l4VWYzUMRUGwKwHtcNVmGzfSwkCv9wodz93CN0qg
次に、Grafana と Promtheus を接続します。以下の通り、 Prometheus Server (Service) は 80 port で待ち受けていますので指定に注意しましょう。
# The Prometheus server can be accessed via port 80 on the following DNS name from within your cluster:
prometheus-server.observation.svc.cluster.local

--

$ kubectl get svc -n observation
NAME                       TYPE        CLUSTER-IP       EXTERNAL-IP   PORT(S)    AGE
grafana                    ClusterIP   172.20.35.67     <none>        8080/TCP   40m
prometheus-node-exporter   ClusterIP   172.20.26.25     <none>        9100/TCP   40m
prometheus-server          ClusterIP   172.20.102.240   <none>        80/TCP     40m
設定値(URL): http://prometheus-server.observation.svc.cluster.local
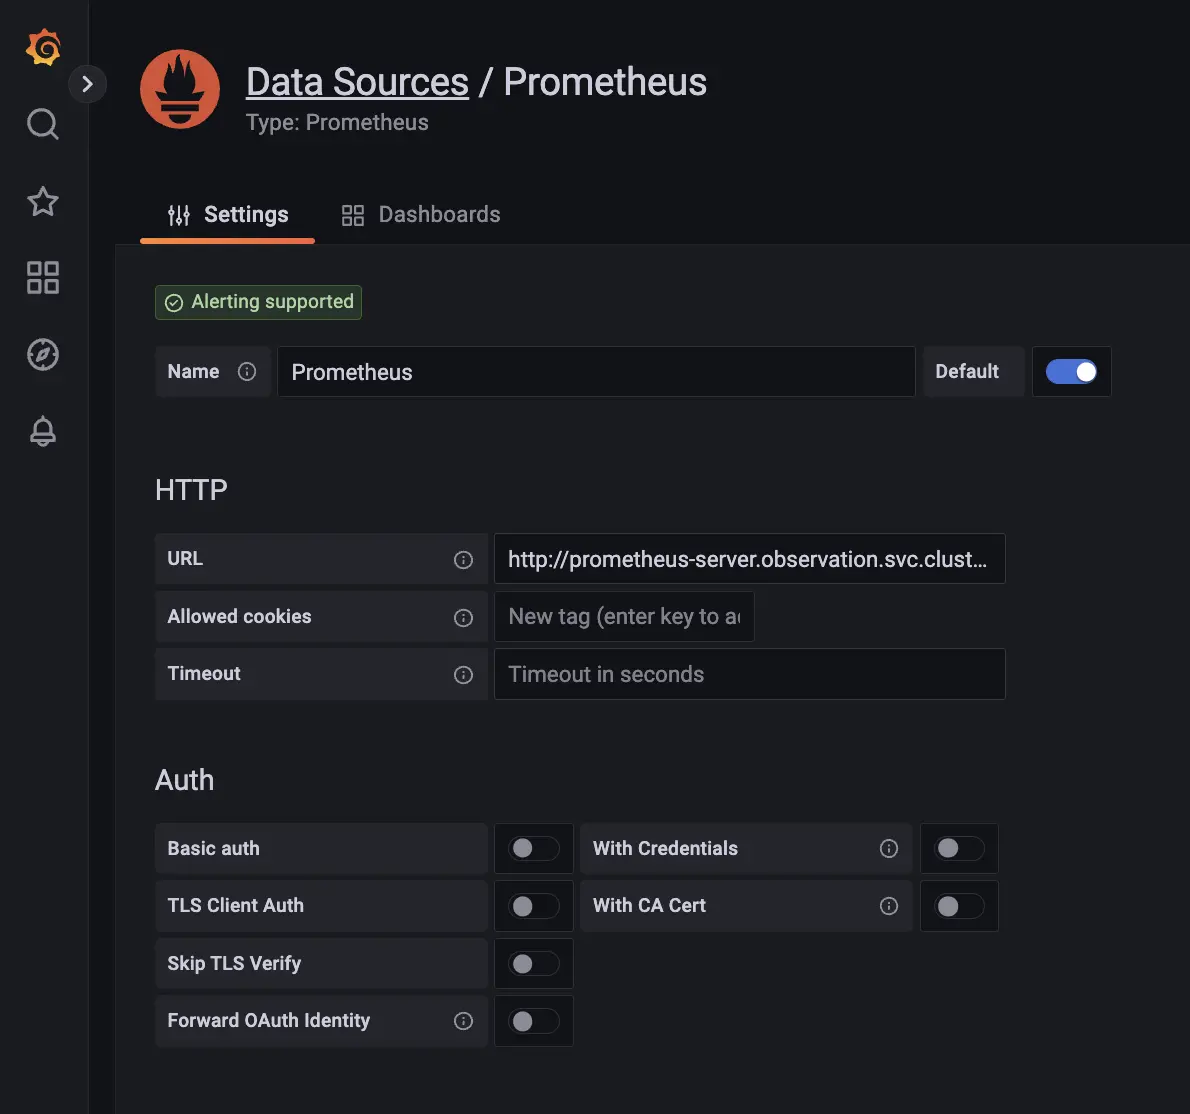
ここまでで接続準備が完了したので、あとは Grafana のパネルで自由にクエリを書くだけです。
実用性の問題
ここでサンプル実装した Prometheus や Grafana は、大部分がデフォルトパラメタで動いています。本番稼働のためにはパラメタを見直す必要があるでしょう。
例えば Prometheus のディスクサイズ (Persistent Volume) は 8GiB でデプロイされるようです。ほか、Grafana は永続性がない設定になっているようで、Pod が Terminate したらデータが失われるとの説明がありました。要確認です。
まとめ
Helm がバージョン3になったこと、および Helmfile を利用することで非常に使い勝手が良い条件が整いました。今後は積極的に利用していけるような気がします。
ただ、何でも Helm で楽をしていると kubectl の使い方やリソースの作成方法や構成理解が身につかず、いざトラブルが発生した時に頭が真っ白になってしまうリスクがあります。初学者の方には引き続き、Helm を利用しないパターンもある程度は勧めたいところです。
参考情報
helmfile apply 実行後のエラー
Adding repo prometheus-community https://prometheus-community.github.io/helm-charts
"prometheus-community" has been added to your repositories

Comparing release=prometheus, chart=prometheus-community/prometheus
in ./helmfile.yaml: in .helmfiles[0]: in prometheus/helmfile.yaml: command "/opt/homebrew/bin/helm" exited with non-zero status:

PATH:
  /opt/homebrew/bin/helm

ARGS:
  0: helm (4 bytes)
  1: diff (4 bytes)
  2: upgrade (7 bytes)
  3: --allow-unreleased (18 bytes)
  4: prometheus (10 bytes)
  5: prometheus-community/prometheus (31 bytes)
  6: --namespace (11 bytes)
  7: observation (11 bytes)
  8: --values (8 bytes)
  9: /var/folders/kq/cgn2jpxd165cq91zp5532mmm0000gn/T/helmfile3235116418/observation-prometheus-values-84c4446b66 (108 bytes)
  10: --detailed-exitcode (19 bytes)
  11: --color (7 bytes)
  12: --reset-values (14 bytes)

ERROR:
  exit status 1

EXIT STATUS
  1

STDERR:
  Error: unknown command "diff" for "helm"
  Run 'helm --help' for usage.

COMBINED OUTPUT:
  Error: unknown command "diff" for "helm"
  Run 'helm --help' for usage.
diff の実行にあたって helm-diff プラグインが必要になる。Kubernetes クラスタへの適用前に差分を表示しプレビューしてくれるので作業品質の向上に貢献してくれそう。
[実行詳細ログ] Prometheus と Grafana セットアップ
Adding repo prometheus-community https://prometheus-community.github.io/helm-charts
"prometheus-community" has been added to your repositories

Comparing release=prometheus, chart=prometheus-community/prometheus
********************

	Release was not present in Helm.  Diff will show entire contents as new.

********************
observation, prometheus-node-exporter, DaemonSet (apps) has been added:
-
+ # Source: prometheus/templates/node-exporter/daemonset.yaml
+ apiVersion: apps/v1
+ kind: DaemonSet
+ metadata:
+   labels:
+     component: "node-exporter"
+     app: prometheus
+     release: prometheus
+     chart: prometheus-15.18.0
+     heritage: Helm
+   name: prometheus-node-exporter
+   namespace: observation
+ spec:
+   selector:
+     matchLabels:
+       component: "node-exporter"
+       app: prometheus
+       release: prometheus
+   updateStrategy:
+     type: RollingUpdate
+   template:
+     metadata:
+       labels:
+         component: "node-exporter"
+         app: prometheus
+         release: prometheus
+         chart: prometheus-15.18.0
+         heritage: Helm
+     spec:
+       serviceAccountName: prometheus-node-exporter
+       containers:
+         - name: prometheus-node-exporter
+           image: "quay.io/prometheus/node-exporter:v1.3.1"
+           imagePullPolicy: "IfNotPresent"
+           args:
+             - --path.procfs=/host/proc
+             - --path.sysfs=/host/sys
+             - --path.rootfs=/host/root
+             - --web.listen-address=:9100
+           ports:
+             - name: metrics
+               containerPort: 9100
+               hostPort: 9100
+           resources:
+             {}
+           securityContext:
+             allowPrivilegeEscalation: false
+           volumeMounts:
+             - name: proc
+               mountPath: /host/proc
+               readOnly:  true
+             - name: sys
+               mountPath: /host/sys
+               readOnly: true
+             - name: root
+               mountPath: /host/root
+               mountPropagation: HostToContainer
+               readOnly: true
+       hostNetwork: true
+       hostPID: true
+       securityContext:
+         fsGroup: 65534
+         runAsGroup: 65534
+         runAsNonRoot: true
+         runAsUser: 65534
+       volumes:
+         - name: proc
+           hostPath:
+             path: /proc
+         - name: sys
+           hostPath:
+             path: /sys
+         - name: root
+           hostPath:
+             path: /
observation, prometheus-node-exporter, Service (v1) has been added:
-
+ # Source: prometheus/templates/node-exporter/svc.yaml
+ apiVersion: v1
+ kind: Service
+ metadata:
+   annotations:
+     prometheus.io/scrape: "true"
+   labels:
+     component: "node-exporter"
+     app: prometheus
+     release: prometheus
+     chart: prometheus-15.18.0
+     heritage: Helm
+   name: prometheus-node-exporter
+   namespace: observation
+ spec:
+   ports:
+     - name: metrics
+       port: 9100
+       protocol: TCP
+       targetPort: 9100
+   selector:
+     component: "node-exporter"
+     app: prometheus
+     release: prometheus
+   type: "ClusterIP"
observation, prometheus-node-exporter, ServiceAccount (v1) has been added:
-
+ # Source: prometheus/templates/node-exporter/serviceaccount.yaml
+ apiVersion: v1
+ kind: ServiceAccount
+ metadata:
+   labels:
+     component: "node-exporter"
+     app: prometheus
+     release: prometheus
+     chart: prometheus-15.18.0
+     heritage: Helm
+   name: prometheus-node-exporter
+   namespace: observation
+   annotations:
+     {}
observation, prometheus-server, ClusterRole (rbac.authorization.k8s.io) has been added:
-
+ # Source: prometheus/templates/server/clusterrole.yaml
+ apiVersion: rbac.authorization.k8s.io/v1
+ kind: ClusterRole
+ metadata:
+   labels:
+     component: "server"
+     app: prometheus
+     release: prometheus
+     chart: prometheus-15.18.0
+     heritage: Helm
+   name: prometheus-server
+ rules:
+   - apiGroups:
+       - ""
+     resources:
+       - nodes
+       - nodes/proxy
+       - nodes/metrics
+       - services
+       - endpoints
+       - pods
+       - ingresses
+       - configmaps
+     verbs:
+       - get
+       - list
+       - watch
+   - apiGroups:
+       - "extensions"
+       - "networking.k8s.io"
+     resources:
+       - ingresses/status
+       - ingresses
+     verbs:
+       - get
+       - list
+       - watch
+   - nonResourceURLs:
+       - "/metrics"
+     verbs:
+       - get
observation, prometheus-server, ClusterRoleBinding (rbac.authorization.k8s.io) has been added:
-
+ # Source: prometheus/templates/server/clusterrolebinding.yaml
+ apiVersion: rbac.authorization.k8s.io/v1
+ kind: ClusterRoleBinding
+ metadata:
+   labels:
+     component: "server"
+     app: prometheus
+     release: prometheus
+     chart: prometheus-15.18.0
+     heritage: Helm
+   name: prometheus-server
+ subjects:
+   - kind: ServiceAccount
+     name: prometheus-server
+     namespace: observation
+ roleRef:
+   apiGroup: rbac.authorization.k8s.io
+   kind: ClusterRole
+   name: prometheus-server
observation, prometheus-server, ConfigMap (v1) has been added:
-
+ # Source: prometheus/templates/server/cm.yaml
+ apiVersion: v1
+ kind: ConfigMap
+ metadata:
+   labels:
+     component: "server"
+     app: prometheus
+     release: prometheus
+     chart: prometheus-15.18.0
+     heritage: Helm
+   name: prometheus-server
+   namespace: observation
+ data:
+   allow-snippet-annotations: "false"
+   alerting_rules.yml: |
+     {}
+   alerts: |
+     {}
+   prometheus.yml: |
+     global:
+       evaluation_interval: 1m
+       scrape_interval: 1m
+       scrape_timeout: 10s
+     rule_files:
+     - /etc/config/recording_rules.yml
+     - /etc/config/alerting_rules.yml
+     - /etc/config/rules
+     - /etc/config/alerts
+     scrape_configs:
+     - job_name: prometheus
+       static_configs:
+       - targets:
+         - localhost:9090
+     - bearer_token_file: /var/run/secrets/kubernetes.io/serviceaccount/token
+       job_name: kubernetes-apiservers
+       kubernetes_sd_configs:
+       - role: endpoints
+       relabel_configs:
+       - action: keep
+         regex: default;kubernetes;https
+         source_labels:
+         - __meta_kubernetes_namespace
+         - __meta_kubernetes_service_name
+         - __meta_kubernetes_endpoint_port_name
+       scheme: https
+       tls_config:
+         ca_file: /var/run/secrets/kubernetes.io/serviceaccount/ca.crt
+         insecure_skip_verify: true
+     - bearer_token_file: /var/run/secrets/kubernetes.io/serviceaccount/token
+       job_name: kubernetes-nodes
+       kubernetes_sd_configs:
+       - role: node
+       relabel_configs:
+       - action: labelmap
+         regex: __meta_kubernetes_node_label_(.+)
+       - replacement: kubernetes.default.svc:443
+         target_label: __address__
+       - regex: (.+)
+         replacement: /api/v1/nodes/$1/proxy/metrics
+         source_labels:
+         - __meta_kubernetes_node_name
+         target_label: __metrics_path__
+       scheme: https
+       tls_config:
+         ca_file: /var/run/secrets/kubernetes.io/serviceaccount/ca.crt
+         insecure_skip_verify: true
+     - bearer_token_file: /var/run/secrets/kubernetes.io/serviceaccount/token
+       job_name: kubernetes-nodes-cadvisor
+       kubernetes_sd_configs:
+       - role: node
+       relabel_configs:
+       - action: labelmap
+         regex: __meta_kubernetes_node_label_(.+)
+       - replacement: kubernetes.default.svc:443
+         target_label: __address__
+       - regex: (.+)
+         replacement: /api/v1/nodes/$1/proxy/metrics/cadvisor
+         source_labels:
+         - __meta_kubernetes_node_name
+         target_label: __metrics_path__
+       scheme: https
+       tls_config:
+         ca_file: /var/run/secrets/kubernetes.io/serviceaccount/ca.crt
+         insecure_skip_verify: true
+     - honor_labels: true
+       job_name: kubernetes-service-endpoints
+       kubernetes_sd_configs:
+       - role: endpoints
+       relabel_configs:
+       - action: keep
+         regex: true
+         source_labels:
+         - __meta_kubernetes_service_annotation_prometheus_io_scrape
+       - action: drop
+         regex: true
+         source_labels:
+         - __meta_kubernetes_service_annotation_prometheus_io_scrape_slow
+       - action: replace
+         regex: (https?)
+         source_labels:
+         - __meta_kubernetes_service_annotation_prometheus_io_scheme
+         target_label: __scheme__
+       - action: replace
+         regex: (.+)
+         source_labels:
+         - __meta_kubernetes_service_annotation_prometheus_io_path
+         target_label: __metrics_path__
+       - action: replace
+         regex: (.+?)(?::\d+)?;(\d+)
+         replacement: $1:$2
+         source_labels:
+         - __address__
+         - __meta_kubernetes_service_annotation_prometheus_io_port
+         target_label: __address__
+       - action: labelmap
+         regex: __meta_kubernetes_service_annotation_prometheus_io_param_(.+)
+         replacement: __param_$1
+       - action: labelmap
+         regex: __meta_kubernetes_service_label_(.+)
+       - action: replace
+         source_labels:
+         - __meta_kubernetes_namespace
+         target_label: namespace
+       - action: replace
+         source_labels:
+         - __meta_kubernetes_service_name
+         target_label: service
+       - action: replace
+         source_labels:
+         - __meta_kubernetes_pod_node_name
+         target_label: node
+     - honor_labels: true
+       job_name: kubernetes-service-endpoints-slow
+       kubernetes_sd_configs:
+       - role: endpoints
+       relabel_configs:
+       - action: keep
+         regex: true
+         source_labels:
+         - __meta_kubernetes_service_annotation_prometheus_io_scrape_slow
+       - action: replace
+         regex: (https?)
+         source_labels:
+         - __meta_kubernetes_service_annotation_prometheus_io_scheme
+         target_label: __scheme__
+       - action: replace
+         regex: (.+)
+         source_labels:
+         - __meta_kubernetes_service_annotation_prometheus_io_path
+         target_label: __metrics_path__
+       - action: replace
+         regex: (.+?)(?::\d+)?;(\d+)
+         replacement: $1:$2
+         source_labels:
+         - __address__
+         - __meta_kubernetes_service_annotation_prometheus_io_port
+         target_label: __address__
+       - action: labelmap
+         regex: __meta_kubernetes_service_annotation_prometheus_io_param_(.+)
+         replacement: __param_$1
+       - action: labelmap
+         regex: __meta_kubernetes_service_label_(.+)
+       - action: replace
+         source_labels:
+         - __meta_kubernetes_namespace
+         target_label: namespace
+       - action: replace
+         source_labels:
+         - __meta_kubernetes_service_name
+         target_label: service
+       - action: replace
+         source_labels:
+         - __meta_kubernetes_pod_node_name
+         target_label: node
+       scrape_interval: 5m
+       scrape_timeout: 30s
+     - honor_labels: true
+       job_name: prometheus-pushgateway
+       kubernetes_sd_configs:
+       - role: service
+       relabel_configs:
+       - action: keep
+         regex: pushgateway
+         source_labels:
+         - __meta_kubernetes_service_annotation_prometheus_io_probe
+     - honor_labels: true
+       job_name: kubernetes-services
+       kubernetes_sd_configs:
+       - role: service
+       metrics_path: /probe
+       params:
+         module:
+         - http_2xx
+       relabel_configs:
+       - action: keep
+         regex: true
+         source_labels:
+         - __meta_kubernetes_service_annotation_prometheus_io_probe
+       - source_labels:
+         - __address__
+         target_label: __param_target
+       - replacement: blackbox
+         target_label: __address__
+       - source_labels:
+         - __param_target
+         target_label: instance
+       - action: labelmap
+         regex: __meta_kubernetes_service_label_(.+)
+       - source_labels:
+         - __meta_kubernetes_namespace
+         target_label: namespace
+       - source_labels:
+         - __meta_kubernetes_service_name
+         target_label: service
+     - honor_labels: true
+       job_name: kubernetes-pods
+       kubernetes_sd_configs:
+       - role: pod
+       relabel_configs:
+       - action: keep
+         regex: true
+         source_labels:
+         - __meta_kubernetes_pod_annotation_prometheus_io_scrape
+       - action: drop
+         regex: true
+         source_labels:
+         - __meta_kubernetes_pod_annotation_prometheus_io_scrape_slow
+       - action: replace
+         regex: (https?)
+         source_labels:
+         - __meta_kubernetes_pod_annotation_prometheus_io_scheme
+         target_label: __scheme__
+       - action: replace
+         regex: (.+)
+         source_labels:
+         - __meta_kubernetes_pod_annotation_prometheus_io_path
+         target_label: __metrics_path__
+       - action: replace
+         regex: (.+?)(?::\d+)?;(\d+)
+         replacement: $1:$2
+         source_labels:
+         - __address__
+         - __meta_kubernetes_pod_annotation_prometheus_io_port
+         target_label: __address__
+       - action: labelmap
+         regex: __meta_kubernetes_pod_annotation_prometheus_io_param_(.+)
+         replacement: __param_$1
+       - action: labelmap
+         regex: __meta_kubernetes_pod_label_(.+)
+       - action: replace
+         source_labels:
+         - __meta_kubernetes_namespace
+         target_label: namespace
+       - action: replace
+         source_labels:
+         - __meta_kubernetes_pod_name
+         target_label: pod
+       - action: drop
+         regex: Pending|Succeeded|Failed|Completed
+         source_labels:
+         - __meta_kubernetes_pod_phase
+     - honor_labels: true
+       job_name: kubernetes-pods-slow
+       kubernetes_sd_configs:
+       - role: pod
+       relabel_configs:
+       - action: keep
+         regex: true
+         source_labels:
+         - __meta_kubernetes_pod_annotation_prometheus_io_scrape_slow
+       - action: replace
+         regex: (https?)
+         source_labels:
+         - __meta_kubernetes_pod_annotation_prometheus_io_scheme
+         target_label: __scheme__
+       - action: replace
+         regex: (.+)
+         source_labels:
+         - __meta_kubernetes_pod_annotation_prometheus_io_path
+         target_label: __metrics_path__
+       - action: replace
+         regex: (.+?)(?::\d+)?;(\d+)
+         replacement: $1:$2
+         source_labels:
+         - __address__
+         - __meta_kubernetes_pod_annotation_prometheus_io_port
+         target_label: __address__
+       - action: labelmap
+         regex: __meta_kubernetes_pod_annotation_prometheus_io_param_(.+)
+         replacement: __param_$1
+       - action: labelmap
+         regex: __meta_kubernetes_pod_label_(.+)
+       - action: replace
+         source_labels:
+         - __meta_kubernetes_namespace
+         target_label: namespace
+       - action: replace
+         source_labels:
+         - __meta_kubernetes_pod_name
+         target_label: pod
+       - action: drop
+         regex: Pending|Succeeded|Failed|Completed
+         source_labels:
+         - __meta_kubernetes_pod_phase
+       scrape_interval: 5m
+       scrape_timeout: 30s
+   recording_rules.yml: |
+     {}
+   rules: |
+     {}
observation, prometheus-server, Deployment (apps) has been added:
+ # Source: prometheus/templates/server/deploy.yaml
+ apiVersion: apps/v1
+ kind: Deployment
+ metadata:
+   labels:
+     component: "server"
+     app: prometheus
+     release: prometheus
+     chart: prometheus-15.18.0
+     heritage: Helm
+   name: prometheus-server
+   namespace: observation
+ spec:
+   selector:
+     matchLabels:
+       component: "server"
+       app: prometheus
+       release: prometheus
+   replicas: 1
+   template:
+     metadata:
+       labels:
+         component: "server"
+         app: prometheus
+         release: prometheus
+         chart: prometheus-15.18.0
+         heritage: Helm
+     spec:
+       enableServiceLinks: true
+       serviceAccountName: prometheus-server
+       containers:
+         - name: prometheus-server-configmap-reload
+           image: "jimmidyson/configmap-reload:v0.5.0"
+           imagePullPolicy: "IfNotPresent"
+           args:
+             - --volume-dir=/etc/config
+             - --webhook-url=http://127.0.0.1:9090/-/reload
+           resources:
+             {}
+           volumeMounts:
+             - name: config-volume
+               mountPath: /etc/config
+               readOnly: true

+         - name: prometheus-server
+           image: "quay.io/prometheus/prometheus:v2.39.1"
+           imagePullPolicy: "IfNotPresent"
+           args:
+             - --storage.tsdb.retention.time=15d
+             - --config.file=/etc/config/prometheus.yml
+             - --storage.tsdb.path=/data
+             - --web.console.libraries=/etc/prometheus/console_libraries
+             - --web.console.templates=/etc/prometheus/consoles
+             - --web.enable-lifecycle
+           ports:
+             - containerPort: 9090
+           readinessProbe:
+             httpGet:
+               path: /-/ready
+               port: 9090
+               scheme: HTTP
+             initialDelaySeconds: 30
+             periodSeconds: 5
+             timeoutSeconds: 4
+             failureThreshold: 3
+             successThreshold: 1
+           livenessProbe:
+             httpGet:
+               path: /-/healthy
+               port: 9090
+               scheme: HTTP
+             initialDelaySeconds: 30
+             periodSeconds: 15
+             timeoutSeconds: 10
+             failureThreshold: 3
+             successThreshold: 1
+           resources:
+             {}
+           volumeMounts:
+             - name: config-volume
+               mountPath: /etc/config
+             - name: storage-volume
+               mountPath: /data
+               subPath: ""
+       dnsPolicy: ClusterFirst
+       securityContext:
+         fsGroup: 65534
+         runAsGroup: 65534
+         runAsNonRoot: true
+         runAsUser: 65534
+       terminationGracePeriodSeconds: 300
+       volumes:
+         - name: config-volume
+           configMap:
+             name: prometheus-server
+         - name: storage-volume
+           persistentVolumeClaim:
+             claimName: prometheus-server
observation, prometheus-server, PersistentVolumeClaim (v1) has been added:
-
+ # Source: prometheus/templates/server/pvc.yaml
+ apiVersion: v1
+ kind: PersistentVolumeClaim
+ metadata:
+   labels:
+     component: "server"
+     app: prometheus
+     release: prometheus
+     chart: prometheus-15.18.0
+     heritage: Helm
+   name: prometheus-server
+   namespace: observation
+ spec:
+   accessModes:
+     - ReadWriteOnce
+   resources:
+     requests:
+       storage: "8Gi"
observation, prometheus-server, Service (v1) has been added:
-
+ # Source: prometheus/templates/server/service.yaml
+ apiVersion: v1
+ kind: Service
+ metadata:
+   labels:
+     component: "server"
+     app: prometheus
+     release: prometheus
+     chart: prometheus-15.18.0
+     heritage: Helm
+   name: prometheus-server
+   namespace: observation
+ spec:
+   ports:
+     - name: http
+       port: 80
+       protocol: TCP
+       targetPort: 9090
+   selector:
+     component: "server"
+     app: prometheus
+     release: prometheus
+   sessionAffinity: None
+   type: "ClusterIP"
observation, prometheus-server, ServiceAccount (v1) has been added:
-
+ # Source: prometheus/templates/server/serviceaccount.yaml
+ apiVersion: v1
+ kind: ServiceAccount
+ metadata:
+   labels:
+     component: "server"
+     app: prometheus
+     release: prometheus
+     chart: prometheus-15.18.0
+     heritage: Helm
+   name: prometheus-server
+   namespace: observation
+   annotations:
+     {}

Upgrading release=prometheus, chart=prometheus-community/prometheus
Release "prometheus" does not exist. Installing it now.
NAME: prometheus
LAST DEPLOYED: Wed Nov 16 20:13:37 2022
NAMESPACE: observation
STATUS: deployed
REVISION: 1
TEST SUITE: None
NOTES:
The Prometheus server can be accessed via port 80 on the following DNS name from within your cluster:
prometheus-server.observation.svc.cluster.local


Get the Prometheus server URL by running these commands in the same shell:
  export POD_NAME=$(kubectl get pods --namespace observation -l "app=prometheus,component=server" -o jsonpath="{.items[0].metadata.name}")
  kubectl --namespace observation port-forward $POD_NAME 9090


#################################################################################
######   WARNING: Pod Security Policy has been moved to a global property.  #####
######            use .Values.podSecurityPolicy.enabled with pod-based      #####
######            annotations                                               #####
######            (e.g. .Values.nodeExporter.podSecurityPolicy.annotations) #####
#################################################################################


For more information on running Prometheus, visit:
https://prometheus.io/

Listing releases matching ^prometheus$
prometheus	observation	1       	2022-11-16 20:13:37.736184 +0900 JST	deployed	prometheus-15.18.0	2.39.1


UPDATED RELEASES:
NAME         CHART                             VERSION
prometheus   prometheus-community/prometheus   15.18.0
Adding repo grafana https://grafana.github.io/helm-charts
"grafana" has been added to your repositories
Comparing release=grafana, chart=grafana/grafana
********************
Release was not present in Helm. Diff will show entire contents as new.
********************
observation, grafana, ConfigMap (v1) has been added:
-
+ # Source: grafana/templates/configmap.yaml
+ apiVersion: v1
+ kind: ConfigMap
+ metadata:
+ name: grafana
+ namespace: observation
+ labels:
+ helm.sh/chart: grafana-6.44.2
+ app.kubernetes.io/name: grafana
+ app.kubernetes.io/instance: grafana
+ app.kubernetes.io/version: "9.2.4"
+ app.kubernetes.io/managed-by: Helm
+ data:
+ grafana.ini: |
+ [analytics]
+ check_for_updates = true
+ [grafana_net]
+ url = https://grafana.net
+ [log]
+ mode = console
+ [paths]
+ data = /var/lib/grafana/
+ logs = /var/log/grafana
+ plugins = /var/lib/grafana/plugins
+ provisioning = /etc/grafana/provisioning
+ [server]
+ domain = ''
observation, grafana, Deployment (apps) has been added:
-
+ # Source: grafana/templates/deployment.yaml
+ apiVersion: apps/v1
+ kind: Deployment
+ metadata:
+ name: grafana
+ namespace: observation
+ labels:
+ helm.sh/chart: grafana-6.44.2
+ app.kubernetes.io/name: grafana
+ app.kubernetes.io/instance: grafana
+ app.kubernetes.io/version: "9.2.4"
+ app.kubernetes.io/managed-by: Helm
+ spec:
+ replicas: 1
+ revisionHistoryLimit: 10
+ selector:
+ matchLabels:
+ app.kubernetes.io/name: grafana
+ app.kubernetes.io/instance: grafana
+ strategy:
+ type: RollingUpdate
+ template:
+ metadata:
+ labels:
+ app.kubernetes.io/name: grafana
+ app.kubernetes.io/instance: grafana
+ annotations:
+ checksum/config: 071186241c412e390d0815974568049ecbd376cebbfbc22885485efbf98e43f3
+ checksum/dashboards-json-config: 01ba4719c80b6fe911b091a7c05124b64eeece964e09c058ef8f9805daca546b
+ checksum/sc-dashboard-provider-config: 01ba4719c80b6fe911b091a7c05124b64eeece964e09c058ef8f9805daca546b
+ checksum/secret: 3c57909cc4d57af927c9e65f757adf3d2f15de051668cccf0a01b07644257813
+ spec:
+
+ serviceAccountName: grafana
+ automountServiceAccountToken: true
+ securityContext:
+ fsGroup: 472
+ runAsGroup: 472
+ runAsUser: 472
+ enableServiceLinks: true
+ containers:
+ - name: grafana
+ image: "grafana/grafana:9.2.4"
+ imagePullPolicy: IfNotPresent
+ volumeMounts:
+ - name: config
+ mountPath: "/etc/grafana/grafana.ini"
+ subPath: grafana.ini
+ - name: storage
+ mountPath: "/var/lib/grafana"
+ ports:
+ - name: grafana
+ containerPort: 3000
+ protocol: TCP
+ env:
+ - name: GF_SECURITY_ADMIN_USER
+ valueFrom:
+ secretKeyRef:
+ name: grafana
+ key: admin-user
+ - name: GF_SECURITY_ADMIN_PASSWORD
+ valueFrom:
+ secretKeyRef:
+ name: grafana
+ key: admin-password
+ - name: GF_PATHS_DATA
+ value: /var/lib/grafana/
+ - name: GF_PATHS_LOGS
+ value: /var/log/grafana
+ - name: GF_PATHS_PLUGINS
+ value: /var/lib/grafana/plugins
+ - name: GF_PATHS_PROVISIONING
+ value: /etc/grafana/provisioning
+ livenessProbe:
+ failureThreshold: 10
+ httpGet:
+ path: /api/health
+ port: 3000
+ initialDelaySeconds: 60
+ timeoutSeconds: 30
+ readinessProbe:
+ httpGet:
+ path: /api/health
+ port: 3000
+ volumes:
+ - name: config
+ configMap:
+ name: grafana
+ - name: storage
+ emptyDir: {}
observation, grafana, PodSecurityPolicy (policy) has been added:
-
+ # Source: grafana/templates/podsecuritypolicy.yaml
+ apiVersion: policy/v1beta1
+ kind: PodSecurityPolicy
+ metadata:
+ name: grafana
+ labels:
+ helm.sh/chart: grafana-6.44.2
+ app.kubernetes.io/name: grafana
+ app.kubernetes.io/instance: grafana
+ app.kubernetes.io/version: "9.2.4"
+ app.kubernetes.io/managed-by: Helm
+ annotations:
+ seccomp.security.alpha.kubernetes.io/allowedProfileNames: 'docker/default,runtime/default'
+ seccomp.security.alpha.kubernetes.io/defaultProfileName: 'docker/default'
+ apparmor.security.beta.kubernetes.io/allowedProfileNames: 'runtime/default'
+ apparmor.security.beta.kubernetes.io/defaultProfileName: 'runtime/default'
+ spec:
+ privileged: false
+ allowPrivilegeEscalation: false
+ requiredDropCapabilities:
+ # Default set from Docker, with DAC_OVERRIDE and CHOWN
+ - ALL
+ volumes:
+ - 'configMap'
+ - 'emptyDir'
+ - 'projected'
+ - 'csi'
+ - 'secret'
+ - 'downwardAPI'
+ - 'persistentVolumeClaim'
+ hostNetwork: false
+ hostIPC: false
+ hostPID: false
+ runAsUser:
+ rule: 'RunAsAny'
+ seLinux:
+ rule: 'RunAsAny'
+ supplementalGroups:
+ rule: 'MustRunAs'
+ ranges:
+ # Forbid adding the root group.
+ - min: 1
+ max: 65535
+ fsGroup:
+ rule: 'MustRunAs'
+ ranges:
+ # Forbid adding the root group.
+ - min: 1
+ max: 65535
+ readOnlyRootFilesystem: false
observation, grafana, Role (rbac.authorization.k8s.io) has been added:
-
+ # Source: grafana/templates/role.yaml
+ apiVersion: rbac.authorization.k8s.io/v1
+ kind: Role
+ metadata:
+ name: grafana
+ namespace: observation
+ labels:
+ helm.sh/chart: grafana-6.44.2
+ app.kubernetes.io/name: grafana
+ app.kubernetes.io/instance: grafana
+ app.kubernetes.io/version: "9.2.4"
+ app.kubernetes.io/managed-by: Helm
+ rules:
+ - apiGroups: ['extensions']
+ resources: ['podsecuritypolicies']
+ verbs: ['use']
+ resourceNames: [grafana]
observation, grafana, RoleBinding (rbac.authorization.k8s.io) has been added:
-
+ # Source: grafana/templates/rolebinding.yaml
+ apiVersion: rbac.authorization.k8s.io/v1
+ kind: RoleBinding
+ metadata:
+ name: grafana
+ namespace: observation
+ labels:
+ helm.sh/chart: grafana-6.44.2
+ app.kubernetes.io/name: grafana
+ app.kubernetes.io/instance: grafana
+ app.kubernetes.io/version: "9.2.4"
+ app.kubernetes.io/managed-by: Helm
+ roleRef:
+ apiGroup: rbac.authorization.k8s.io
+ kind: Role
+ name: grafana
+ subjects:
+ - kind: ServiceAccount
+ name: grafana
+ namespace: observation
observation, grafana, Secret (v1) has been added:
+ # Source: grafana/templates/secret.yaml
+ apiVersion: v1
+ kind: Secret
+ metadata:
+ labels:
+ app.kubernetes.io/instance: grafana
+ app.kubernetes.io/managed-by: Helm
+ app.kubernetes.io/name: grafana
+ app.kubernetes.io/version: 9.2.4
+ helm.sh/chart: grafana-6.44.2
+ name: grafana
+ namespace: observation
+ data:
+ admin-password: '++++++++ # (40 bytes)'
+ admin-user: '++++++++ # (5 bytes)'
+ ldap-toml: '++++++++ # (0 bytes)'
+ type: Opaque
observation, grafana, Service (v1) has been added:
-
+ # Source: grafana/templates/service.yaml
+ apiVersion: v1
+ kind: Service
+ metadata:
+ name: grafana
+ namespace: observation
+ labels:
+ helm.sh/chart: grafana-6.44.2
+ app.kubernetes.io/name: grafana
+ app.kubernetes.io/instance: grafana
+ app.kubernetes.io/version: "9.2.4"
+ app.kubernetes.io/managed-by: Helm
+ spec:
+ type: ClusterIP
+ ports:
+ - name: service
+ port: 8080
+ protocol: TCP
+ targetPort: 3000
+ selector:
+ app.kubernetes.io/name: grafana
+ app.kubernetes.io/instance: grafana
observation, grafana, ServiceAccount (v1) has been added:
-
+ # Source: grafana/templates/serviceaccount.yaml
+ apiVersion: v1
+ kind: ServiceAccount
+ metadata:
+ labels:
+ helm.sh/chart: grafana-6.44.2
+ app.kubernetes.io/name: grafana
+ app.kubernetes.io/instance: grafana
+ app.kubernetes.io/version: "9.2.4"
+ app.kubernetes.io/managed-by: Helm
+ name: grafana
+ namespace: observation
observation, grafana-clusterrole, ClusterRole (rbac.authorization.k8s.io) has been added:
-
+ # Source: grafana/templates/clusterrole.yaml
+ kind: ClusterRole
+ apiVersion: rbac.authorization.k8s.io/v1
+ metadata:
+ labels:
+ helm.sh/chart: grafana-6.44.2
+ app.kubernetes.io/name: grafana
+ app.kubernetes.io/instance: grafana
+ app.kubernetes.io/version: "9.2.4"
+ app.kubernetes.io/managed-by: Helm
+ name: grafana-clusterrole
+ rules: []
observation, grafana-clusterrolebinding, ClusterRoleBinding (rbac.authorization.k8s.io) has been added:
-
+ # Source: grafana/templates/clusterrolebinding.yaml
+ kind: ClusterRoleBinding
+ apiVersion: rbac.authorization.k8s.io/v1
+ metadata:
+ name: grafana-clusterrolebinding
+ labels:
+ helm.sh/chart: grafana-6.44.2
+ app.kubernetes.io/name: grafana
+ app.kubernetes.io/instance: grafana
+ app.kubernetes.io/version: "9.2.4"
+ app.kubernetes.io/managed-by: Helm
+ subjects:
+ - kind: ServiceAccount
+ name: grafana
+ namespace: observation
+ roleRef:
+ kind: ClusterRole
+ name: grafana-clusterrole
+ apiGroup: rbac.authorization.k8s.io
Upgrading release=grafana, chart=grafana/grafana
Release "grafana" does not exist. Installing it now.
NAME: grafana
LAST DEPLOYED: Wed Nov 16 20:13:47 2022
NAMESPACE: observation
STATUS: deployed
REVISION: 1
NOTES:
1. Get your 'admin' user password by running:
kubectl get secret --namespace observation grafana -o jsonpath="{.data.admin-password}" | base64 --decode ; echo
2. The Grafana server can be accessed via port 8080 on the following DNS name from within your cluster:
grafana.observation.svc.cluster.local
Get the Grafana URL to visit by running these commands in the same shell:
export POD_NAME=$(kubectl get pods --namespace observation -l "app.kubernetes.io/name=grafana,app.kubernetes.io/instance=grafana" -o jsonpath="{.items[0].metadata.name}")
kubectl --namespace observation port-forward $POD_NAME 3000
3. Login with the password from step 1 and the username: admin
#################################################################################
###### WARNING: Persistence is disabled!!! You will lose your data when #####
###### the Grafana pod is terminated. #####
#################################################################################
Listing releases matching ^grafana$
grafana observation 1 2022-11-16 20:13:47.090293 +0900 JST deployed grafana-6.44.2 9.2.4
UPDATED RELEASES:
NAME CHART VERSION
grafana grafana/grafana 6.44.2